This formatting applies to widgets that contain tables. For example, table formatting is possible for widgets such as Table and Cross Table.
To format the chart, follow the steps given below.
- Create the number of charts as required. Refer to Creating Charts using Widgets.
- Select the widget that you want to format (Table or Cross Table).
- In the WIDGET pane, click FORMAT.
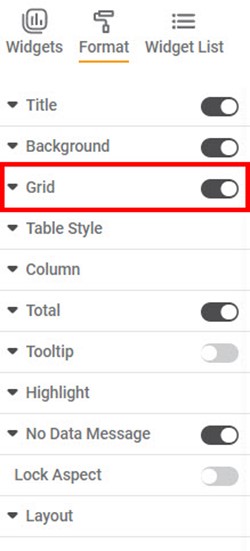
Depending on the selected type of widget, the formatting options are displayed. - To enable and format a field, turn the corresponding toggle button ON ().
For example, here, we have enabled the Grid field. - Click Grid.
All the formatting options within the Grid field are displayed. You can change,
- Color and width of the vertical grid lines
- Color and width of the horizontal grid lines
Similarly, for Grid, you can format other fields like Column Header, Row Header, Values, Title, Hyperlink, Sub Total, Background, No Data Message, Layout, and Lock Aspect to format the table as required.
For more Table formatting options, please refer to RubiSight Widget Reference Guide.

