What is a Widget
A widget is a RubiSight dashboard component that can be a chart, a graph, a map, a card, an image, or a table. Each of these widgets has a specific purpose and is used to enhance the visual appeal and the presentation of the data.
These widgets are chosen based on the
- Number of dimensions to be plotted
- Available variables and their types
- Kind of correlation or comparison expected to be plotted
- Trends, patterns, and predictions to be built
- Kind of story you want to create out of the available data
Elements of Widget
Each widget needs specific elements or a set of parameters to build. The choice of these parameters depends on the type of widget being used. Some widgets are built based on just one parameter, while some others need four to five parameters. The most common parameters/elements present in the widgets are explained below.
X-Axis
X-axis, or the horizontal axis, is used to plot the independent variable. It can either be a numerical or categorical variable. The coordinates on the X-axis are called labels, and the variable represented on the X-axis is called the title.
Y-Axis
Y-axis, or the vertical axis, is used to plot the dependent variable. It can either be a numerical or a categorical variable. The coordinates on the Y-axis are called labels, and the variable represented on the Y-axis is called the title.
The plot (area on the chart between the X-axis and Y-axis) is usually divided into gridlines. These gridlines form a mesh of crisscross horizontal and vertical dotted lines. These lines make it easy to plot the graph or chart and helps us understand them better.
Legend
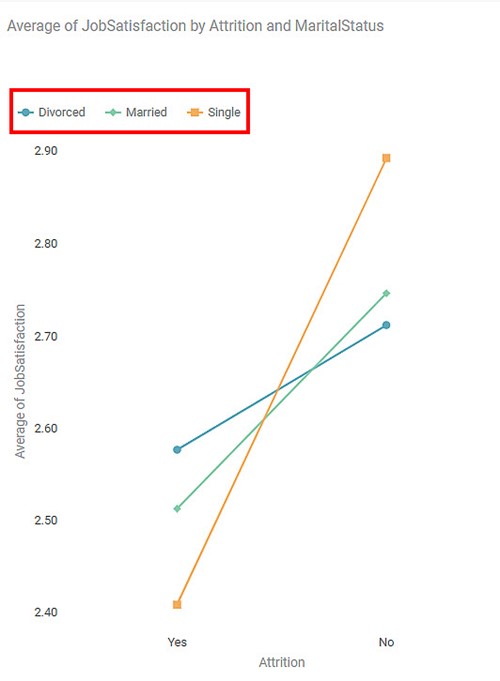
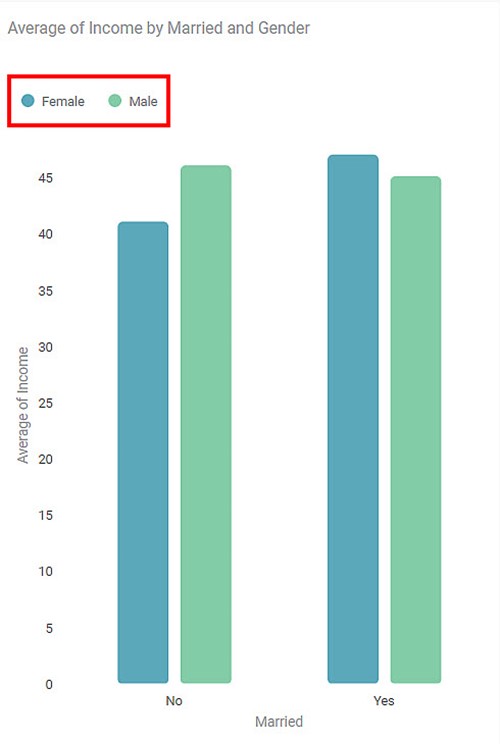
A legend (in a chart or graph) shows the kind of data represented by the chart. Legends explain the markings, symbols, colors, and characters on a chart or graph.
In the chart shown below, the highlighted portion gives the color legends used in the chart. It indicates the colors corresponding to the three categories of products.
An example chart with Legend as Marital Status is shown below.
Another example chart with Legend as Gender is shown below.
Dimensions
Dimensions represent the categorical variables in the given dataset.
Measures
Measures represent the continuous numerical variables in the given dataset.
Notes: |
|
Table of Contents

