You can also format the dashboard page on which the chart is plotted. You can change the page size and also use a different theme (color palette) for the chart.
To format the dashboard page, follow the steps given below.
- Open the Dashboard in edit mode. Refer to Editing a Dashboard.
The Dashboard is displayed. - In the WIDGET pane, click FORMAT. Make sure you have not selected any chart on the dashboard canvas.
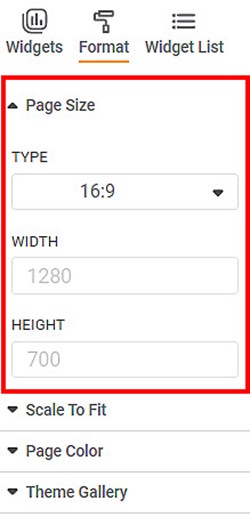
The Page Size and Theme Gallery fields are displayed. - Click Page Size.
All the formatting options within the General field are displayed. You can change,
- Type of page (Aspect ratio 16:9, 4:3, Letter or Custom)
- Page width and height
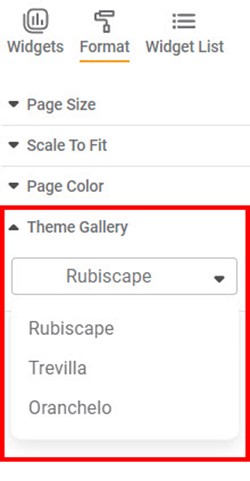
Similarly, you can format the Theme Gallery. Theme Gallery helps you to select the color theme. It changes the look and feel of the widget.

