Exporting charts and data helps you store/save them in your device or on the cloud. You can then share or view the chart in PDF format and data in CSV format.
Exporting Chart
To export the chart, follow the steps given below.
- Create the number of charts as required. Refer to Creating Charts using Widgets.
- Select the widget that you want to export.
- On the top right corner of the widget, click the More Options ellipsis ( ).
The available options are displayed. - Click the Export Chart In PDF option.
The selected widget is saved as a PDF file in your default download folder.
Exporting Data
To export data, follow the steps given below.
- Create the number of charts as required. Refer to Creating Charts using Widgets.
- Select the widget from which you want to export data.
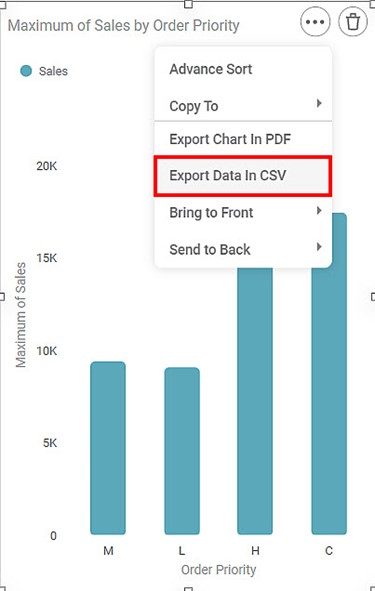
- On the top right corner of the widget, click the More Options ellipsis ( ).
The available options are displayed.
- Click the Export Data In CSV
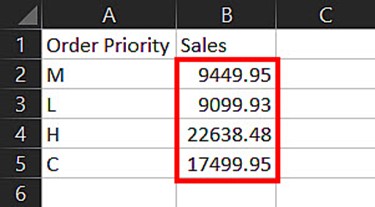
The data of the selected widget is saved as a CSV file in your default download folder.
For example, we plot a Column Chart of the Maximum of Sales by Order Priorityin a sales dataset, as shown below.
A snippet of the data stored in the CSV file for the above Column Chart is shown below.
Now, let’s sort the widget by arranging the Maximum of Sales in the Ascending Order. The resultant widget is as shown below.
Now, we export the data from the sorted chart as CSV. A snippet of the data is shown below.
You can see that the data in the new CSV file is also arranged in the same order as the chart, that is, Ascending order.
Notes: |
|
Table of Contents


