Date Part Options
Rubisight provides various date parts along with the date in the dimensions pane. You can use the following date parts as dimensions
- Year
- Quarter
- Month
- Day
- Weekday
- Week number
Let’s study these options in the below sections.
Consider the Airpassenger dataset with their traveling date as other information.
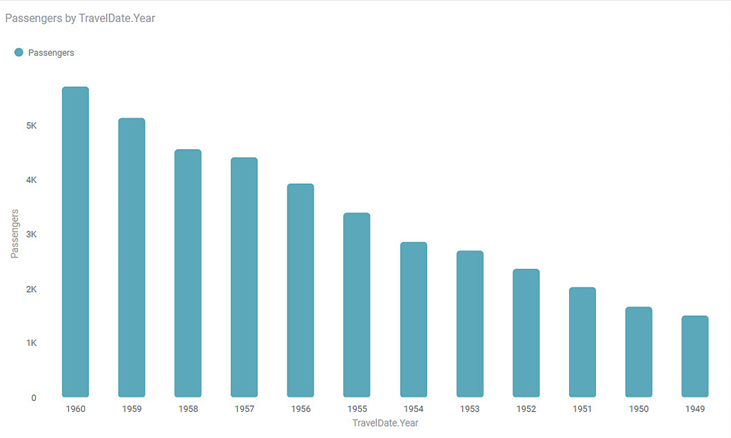
Date.Year
When you check this dimension, the year part from the date is extracted from the date part. Then data is plotted accordingly.
The following graph displays the number of passengers traveling per year from 1949 to 1960 for specified years.
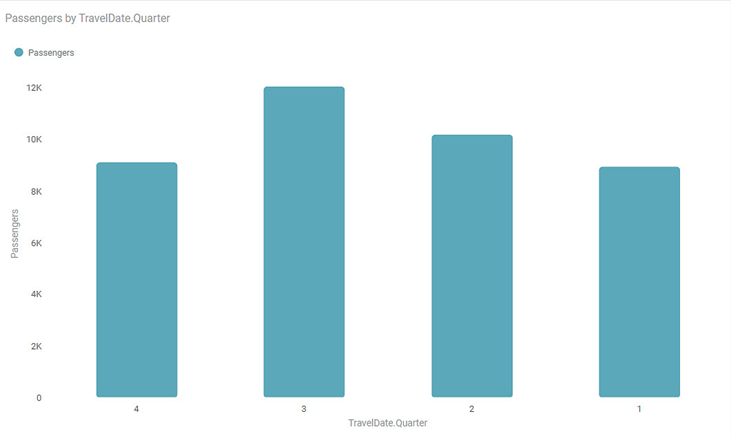
Date.Quarter
When you check this option, the data is segregated into 4 quarters. The Year is not considered in this segregation.
The following graph displays the number of passengers traveling per quarter.
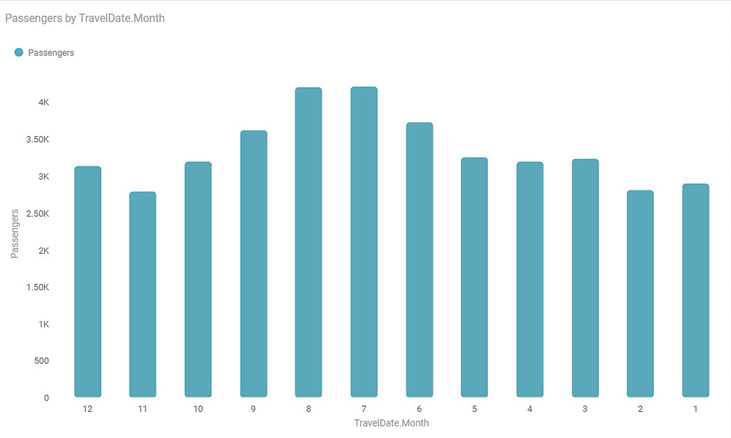
Date.Month
When you check this option, the data is segregated into 12 months. The Year is not considered in this segregation.
The following graph displays the number of passengers traveling per month for specified years.
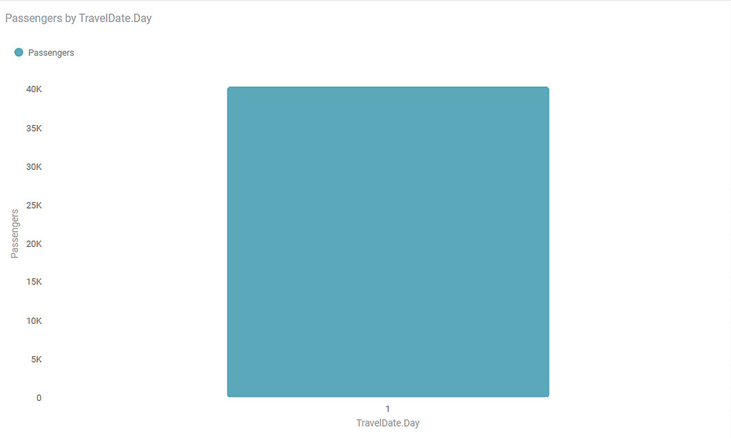
Date.Day
When you check this option, the data is segregated into 31 days. The Year is not considered in this segregation.
The following graph displays the number of passengers traveling per day for specified years.
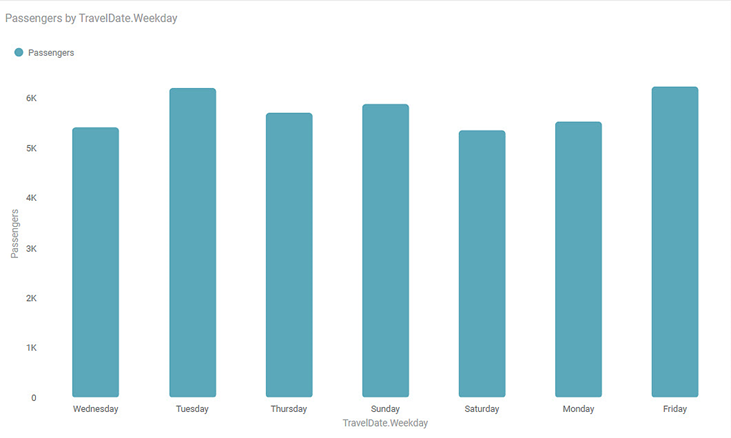
Date.Weekday
When you check this option, the data is segregated into 7 weekdays. The Year is not considered in this segregation.
The following graph displays the number of passengers traveling per weekday for specified years.
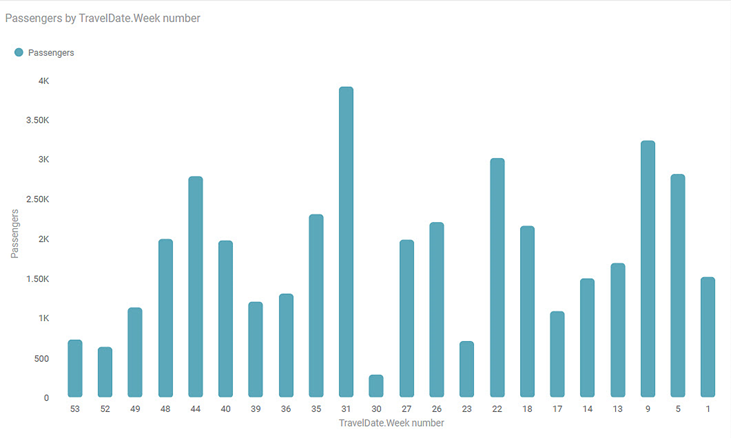
Date.Week number
When you check this option, the data is segregated into 53 weeks. The Year is not considered in this segregation.
The following graph displays the number of passengers traveling per week for specified years.
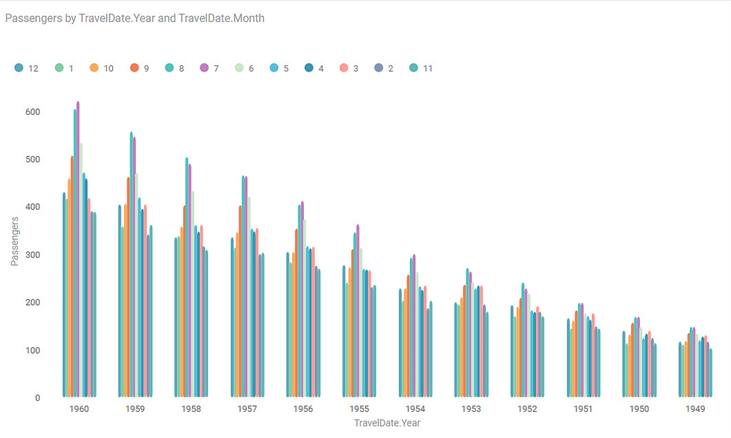
Plotting Date.Year and Date.Month Number
Many times you want to plot a graph using more than one parameter. Consider that you want to plot a bar chart for month-wise and year-wise passengers. Plot the bar chart using the Date. Year and Date.Month to implement this requirement.
The following graph displays month-wise and year-wise passengers.
Table of Content
