Formatting a widget page allows you to
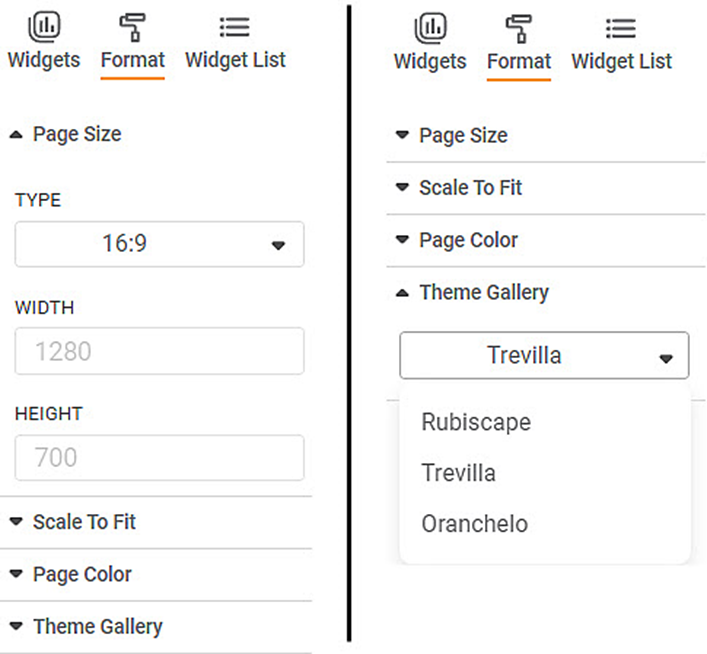
- Change the page size
- Use a different theme (color palette) from the theme gallery for the chart.
The table below describes different fields present on widget page formatting.
Field | Description | Remark |
|---|---|---|
Page Size | It allows you to select the following options
|
|
Theme Gallery | It allows you to select the theme in which the widget is to be displayed. |
|
To use Widget Page formatting options, first plot a Bar Chart using the dimensions and measures from the dataset. For example, we plot a Bar chart of the Count of Cards against Gender. The Ethnicity of the sample is the Legend dimension.
The figure given below shows an original image of the Bar Chart. By default,
- Page Size Type: 16:9
- Theme: Rubiscape
- Width: 1280 (unchangeable)
- Height: 700 (unchangeable)
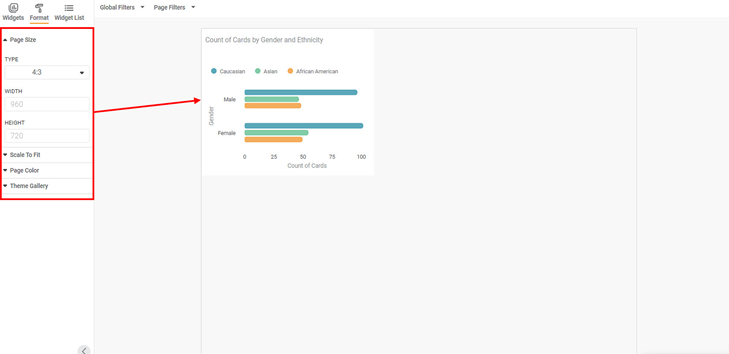
From the Type drop-down, select the Page Size as 4:3.
The dashboard canvas is resized, that is, the width and height change. Accordingly, the position of the image also changes.
- Page Size Type: 4:3
- Theme: Rubiscape
- Width: 960 (unchangeable)
- Height: 700 (unchangeable)
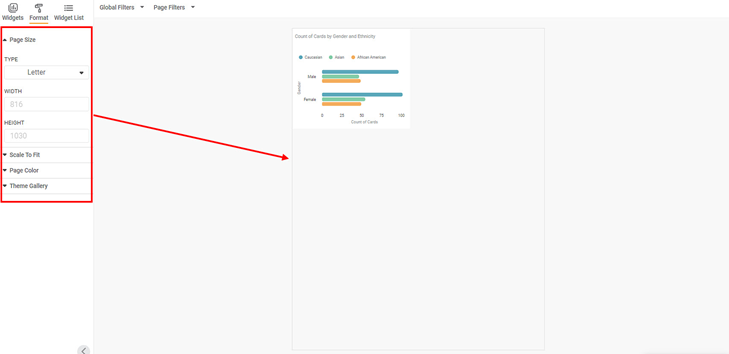
Now, from the Type drop-down, select the Page Size as Letter.
The dashboard canvas is resized, that is, the width and height change. Accordingly, the position of the image also changes.
- Page Size Type: Letter
- Theme: Rubiscape
- Width: 816 (unchangeable)
- Height: 1030 (unchangeable)
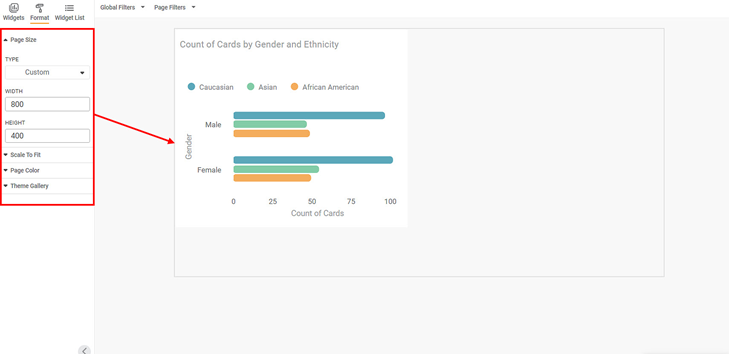
Now, from the Type drop-down, select the Page Size as Custom.
Here you can manually resize the dashboard canvas by selecting the desired width and height for the canvas. Accordingly, the position and size of the image also change.
- Page Size Type: Custom
- Theme: Rubiscape
- Width: 800 (changeable)
- Height: 400 (changeable)
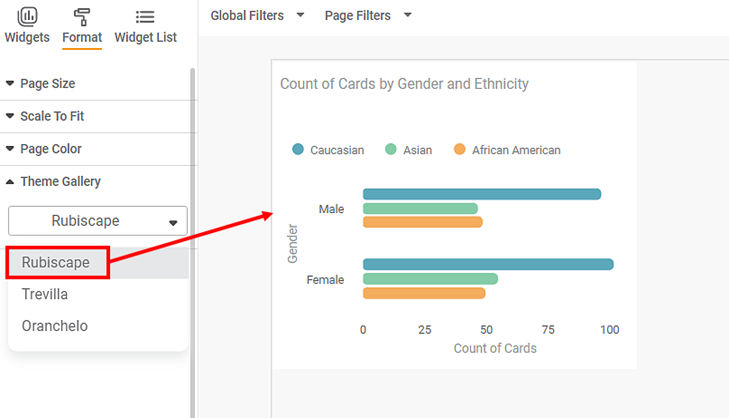
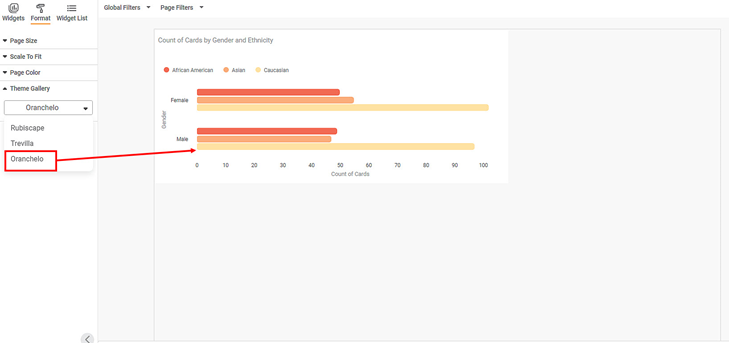
Now, retain the Page Size to 16:9 type. From the theme gallery, select the Oranchelo theme.
The color palette of the image changes. The page width and height remain the same.
- Page Size Type: 16:9
- Theme: Oranchelo
- Width: 1280 (unchangeable)
- Height: 700 (unchangeable)
