Scale to Fit allows you to change the Widget visualization fit in View Mode depending on the available space. Hence, after selecting any of these options, click Save and switch to View Mode to visualize the fit.
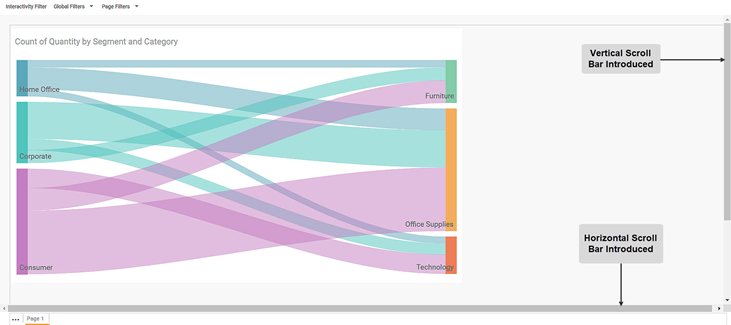
A vertical and horizontal scroll bar is provided if the dashboard page contains an appreciably large widget, or several widgets plotted. The table given below describes different fields present on widget page formatting.
Type | Description | Remark |
Page | It creates a widget visualization where the widget gets fitted strictly in the selected Page Size (16:9, 4:3, Letter, or Custom) |
|
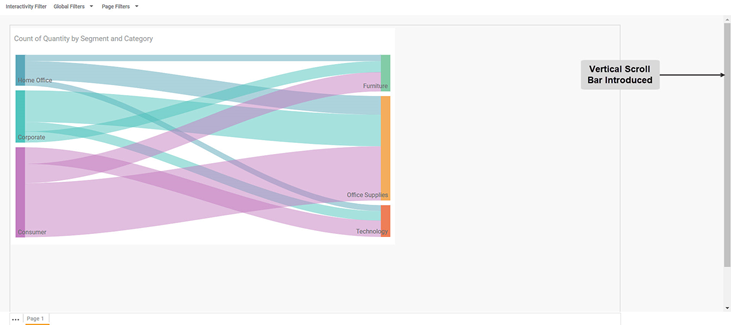
Width | It creates a widget visualization where the entire width of the available space in View Mode is used. | If needed, a vertical scroll bar is provided to ensure that the entire page is visible. |
Standard | It creates a widget visualization where the widget is fitted to its standard size. |
|
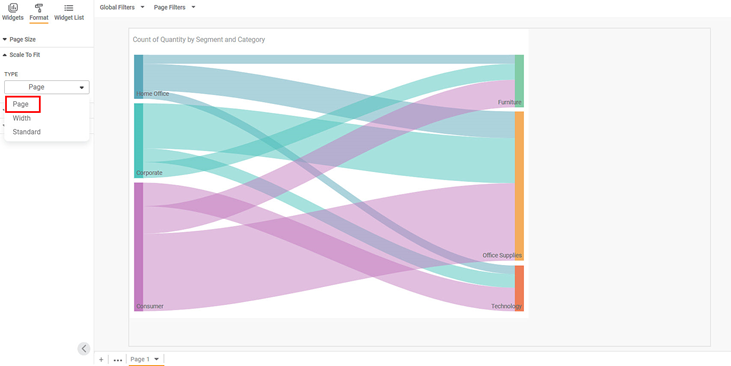
To use the Scale to Fit formatting options, first plot a widget using appropriate dimensions and measures from the dataset. For example, we plot a Sankey Chart of the Count of Quantity by Segment and Category. By default, the Scale To Fit type selected is Page.
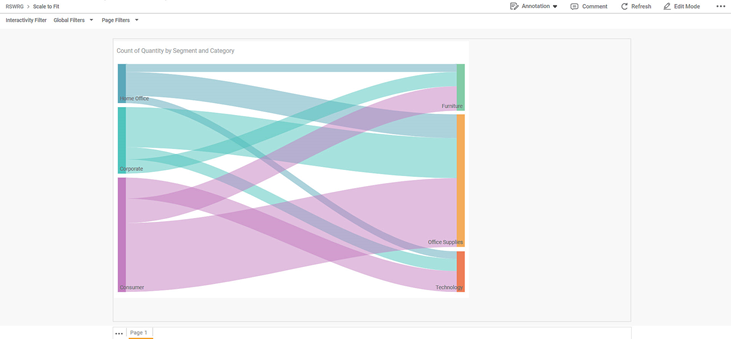
Now, click Save and then View Mode. The chart visualization is as seen below. The space on the two sides of the canvas is empty.
Now, navigate back to the Edit Mode and change the Page To Fit type to width. Click Save, and then View Mode. The chart visualization is as seen below.
Similarly, change the Page To Fit type to Standard. Click Save, and then View Mode. The chart visualization is as seen below.


