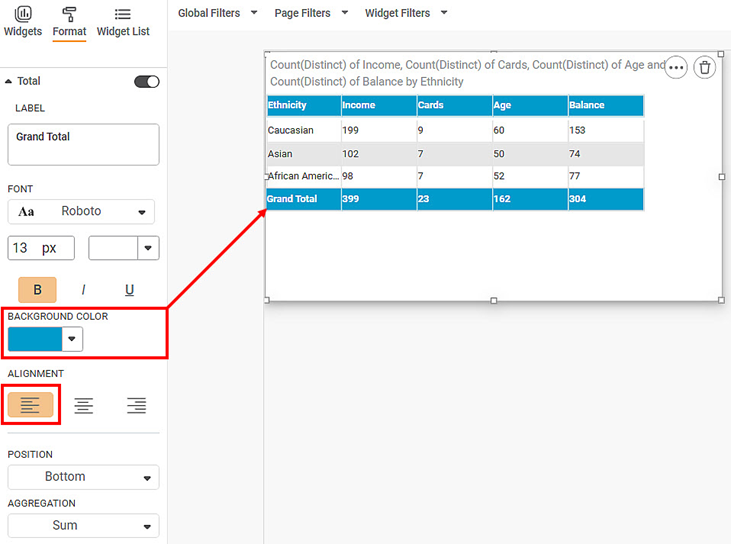
The Total formatting option is available in the Table chart.
The table given below describes different fields present on Total formatting.
Field | Description | Remark |
|---|---|---|
Label | It allows you to select the label you want to assign for the Total column. | — |
Font | It allows you to change the appearance of the data label. |
|
Background Color | It allows you to change the background of the region where the title is displayed. | By default, the color is white. |
Alignment | It allows you to select the text alignment. | The options are Left, Right, and Center. |
To use Total formatting options, first plot a Table chart using the measures from the dataset. For example, we plot a Table Chart of Income.
The figure given below shows an original image of the Table Chart.
Now,
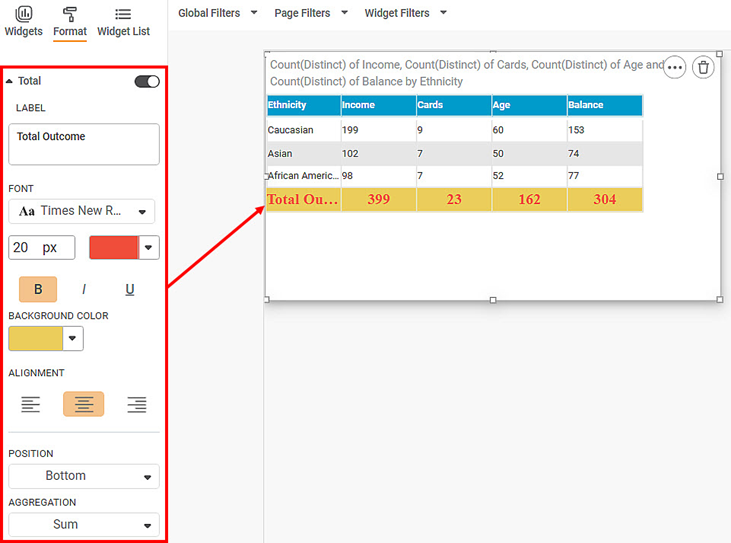
- Change the Label text, font type, font size, and font color.
- Make the text bold, italic, and underline it.
- Change the text alignment.
- Change the Background color.
- Change the border color and width.
The resultant widget is shown below.


