In RubiSight, you can plot a Cross Table using multiple features from the dataset. A Cross Table contains the following configuration options.
- Rows
- Columns
- Values
The Stepped Layout option is available under Row in Cross Table formatting options.
Stepped Layout is used to convert a list of data field values in a feature into a drop-down.
To view the effect of the Stepped Layout formatting option, first plot a Cross Table using dimensions and measures from the Superstore dataset.
| By default, the Stepped Layout toggle button () is OFF, that is, disabled. |
In the example below, we plot a Cross Table by selecting
- Married and Gender as Row variables
- Ethinicity as the Column variable
- Income(Average) and Cards(Average) as Value variables
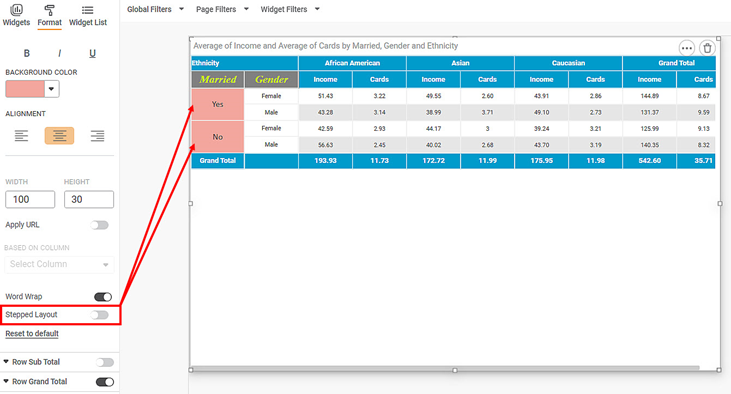
The figure below shows the widget with the Formatting view.
Observations:
In the above Cross Table,
- By default,
- Row variables are displayed as the row headers
- Ethinicity variable is displayed as main column header
- Value variables are displayed as second-level column headers
- The Married values are displayed as row header in the first Column.
- The Gender values are displayed as row header in the Second Column.
To view the impact of enabling the Stepped Layout toggle button, follow the steps given below.
- Click Format in the widget pane.
You notice that the Stepped Layout toggle button is OFF, that is, disabled. - Now click the toggle button to enable it ().
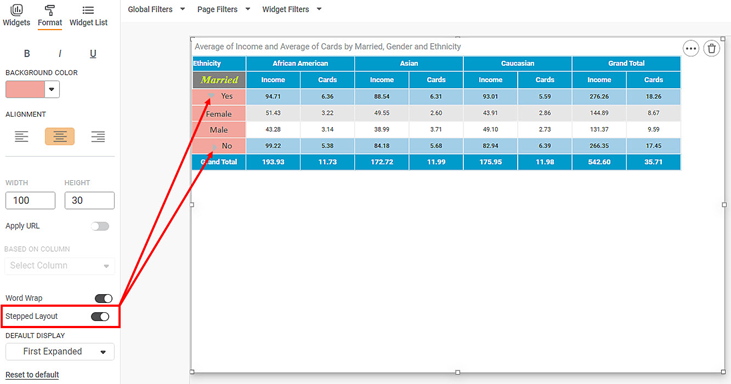
The appearance of the Cross Table changes.
Observations:
In the above Cross Table,
- The Ethinicity headers are displayed as Column heading in the first Column.
- The Gender values are displayed as a drop-down list in the first Column. It makes the Cross Table appear compact. As required, you can click the drop-down and view the variables.

