Shapiro-Wilk Test | |||
Description | The Shapiro-Wilk test is a normality test in probability determination statistics. It is used to determine whether a simple random sample of a variable’s values has been derived from a normal distribution. | ||
Why to use | For normality test | ||
When to use | To find out whether a random sample has been derived from a normal distribution. | When not to use | On data other than numerical data. |
Prerequisites |
| ||
Input | Any dataset that contains numerical data.
| Output |
|
Statistical Methods used | NA | Limitations |
|
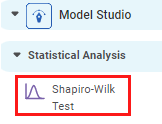
Shapiro-Wilk Test is located under Model Studio () in Statistical Analysis in the task pane on the left. Use the drag-and-drop method (or double-click on the node) to use the algorithm in the canvas. Click the algorithm to view and select different properties for analysis.
Refer to Properties of Shapiro-Wilk Test.
The p-value is the probability of attaining observed results of a statistical hypothesis test, assuming that the null hypothesis is true.
The null hypothesis of the Shapiro-Wilk test is – Input data comes from a normal distribution, while the alternative hypothesis is – Input data does not come from a normal distribution.
The Shapiro-Wilk test rejects the null hypothesis of normality when the p-value is less than or equal to 0.05. Failing the normality test allows you to state with 95% confidence that the data does not fit the normal distribution. Passing the normality test enables you to declare that no significant departure from normality was found.
The test generates a W Statistic value which depends on the ordered random sample values and the constants generated by covariances, variances, and means of a normally distributed random sample. If the W Statistic value is small, the null hypothesis is rejected, and it can be concluded that the random sample is not normally distributed.
Shapiro-Wilk normality test generates a significant result if the sample size is sufficiently large.
Properties of Shapiro-Wilk Test
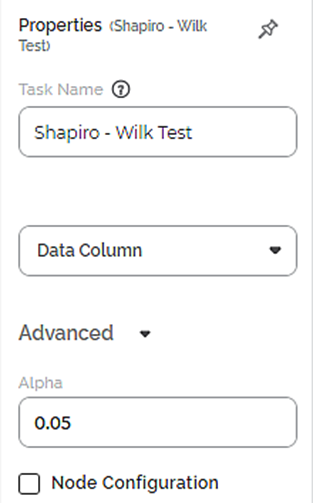
The available properties of the Shapiro-Wilk Test are as shown in the figure given below.
The table given below describes the different fields present on the Properties pane of the Shapiro-Wilk Test.
Field | Description | Remark | |
Task Name | It displays the name of the selected task. | You can click the text field to edit or modify the name of the task as required. | |
Data Column | It allows you to select the numerical variable for which you need to perform the task. | · Only numerical values are available. · Only one data field can be selected. | |
Advanced | Alpha | It allows you to set the level of significance. | The default value is 0.05. |
Node Configuration | It allows you to select the instance of the AWS server to provide control on the execution of a task in a workbook or workflow. | For more details, refer to Worker Node Configuration. | |
Example of Shapiro-Wilk Test
Consider a dataset of the count of the chemical composition of wine sample. A snippet of input data is shown in the figure given below.
In the Properties pane of the Shapiro-Wilk Test, the value selected in Data Column is Alcohol.
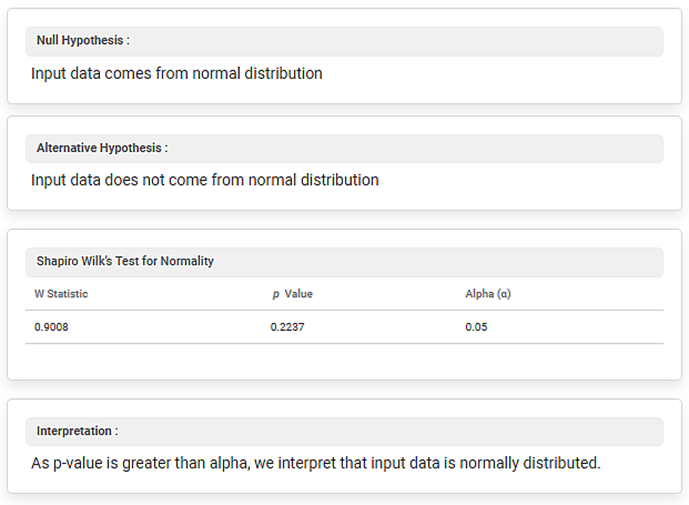
The Result page of the Shapiro-Wilk Test is shown in the figure given below.
The Result page displays the Null Hypothesis and Alternative Hypothesis. It also displays the W Statistic, p-Value, and Alpha (α) under Shapiro Wilk’s Test for Normality metrics.
In the above example, the value of the W Statistic is 0.9008, p-Value is 0.2237, and Alpha is 0.05.
Thus, you can see that the p value is more than the value of alpha. Hence, the input data is normally distributed.
Table of contents


