k Nearest Neighbor Regression | |||
Description | k Nearest Neighbor (KNN) Regression enables you to predict new data points based on the known classification of other points. In kNN, we take a bunch of labeled points and then learn how to label other points. | ||
Why to use | To predict the classification of a new data point using data with multiple classes. | ||
When to use |
| When not to use |
|
Prerequisites |
| ||
Input | Any numerical data. | Output | Predicted classification of a new data point. |
Statistical Methods used |
| Limitations |
|
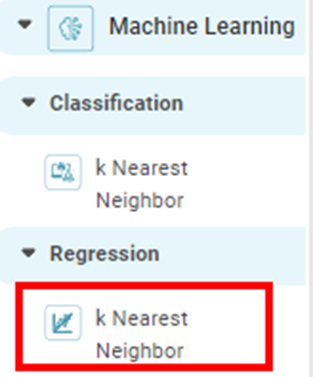
k Nearest Neighbor Regression is located under Machine Learning () in Regression, in the left task pane. Use the drag-and-drop method to use the algorithm in the canvas. Click the algorithm to view and select different properties for analysis.
Refer to Properties of k Nearest Neighbor Regression.
The k-nearest neighbor is a simple and easy-to-use supervised machine learning (ML) algorithm that can be applied to solve regression and classification problems. It assumes that similar things (for example, data points with similar values) exist in proximity. It combines simple mathematical techniques with this similarity to determine the distance between different points on a graph.
The input consists of the k number of training samples that are closest to each other. The output, a class membership, depends on whether the algorithm is being used for regression or classification. In the case of regression, the mean of k labels is returned, while in the case of classification, the mode of k labels is returned.
Classification is done by a vote of majority of the k nearest neighbors, and the new data point is assigned to the class among its k closest neighbors.
Properties of k Nearest Neighbor Regression
The available properties of k Nearest Neighbor Regression are as shown in the figure given below.
The table given below describes the different fields present on the properties of Lasso Regression.
Field | Description | Remark | |
Task Name | It is the name of the task selected on the workbook canvas. | You can click the text field to edit or modify the name of the task as required. | |
Dependent Variable | It allows you to select the dependent variable. | You can select only one variable, and it should be of numeric type. | |
Independent Variables | It allows you to select Independent variables. |
| |
Advanced | Number of Neighbors | It allows you to enter the number of neighboring data points to be checked. | The default value is 5. |
Distance Method | It allows you to select the method to calculate the distance between two data points. | The available options are -
| |
Dimensionality Reduction | It allows you to select the dimensionality reduction method. |
| |
Example of k Nearest Neighbor Regression
Consider a Credit Card Balance dataset of people of different gender, age, education, and so on. A snippet of input data is shown in the figure given below.
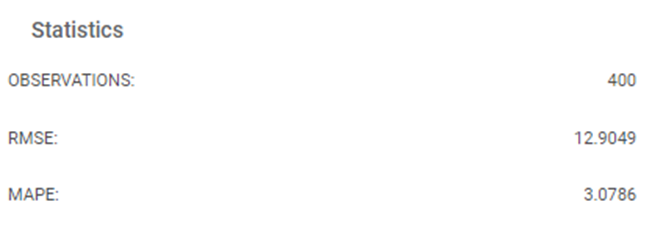
The table below describes the performance metrics on the result page.
Performance Metric | Description | Remark |
RMSE (Root Mean Squared Error) | It is the square root of the averaged squared difference between the actual values and the predicted values. | It is the most commonly used metric for regression tasks. |
MAPE (Mean Absolute Percentage Error) | It is the average of absolute percentage errors. | — |
As seen in the above figure, the values for different parameters are –
Table of Contents


