Aggregation | |||||
Description | Aggregation of categorical data involves the gathering of information for statistical analysis and expressing it in a summarized form. | ||||
Why to use | Numerical Analysis – Data Preparation | ||||
When to use | When you want to collect specific information about particular groups based on specific variables. | When not to use | On textual data. | ||
Prerequisites | It should be used on numerical and categorical data. | ||||
Input | Any dataset that contains categorical as well as numerical data. | Output | Aggregated numerical or categorical data. | ||
Statistical Methods used |
| Limitations | Sometimes using only aggregation is not enough as it gives only single level analysis. You may need to use other methods to get accurate results. | ||
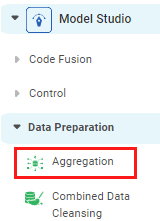
Aggregation is located under Model Studio () in Data Preparation, in the task pane on the left. Use drag-and-drop method to use the algorithm in the canvas. Click the algorithm to view and select different properties for analysis. Refer to Properties of Aggregation.
Aggregation is a group-by algorithm in which a given data is grouped for a certain categorical data variable like name, date, color, educational level and so on. The data that is grouped is the numerical data and is called the Aggregate Function. You cannot use this algorithm unless you have selected the GroupBy function.
Properties of Aggregation
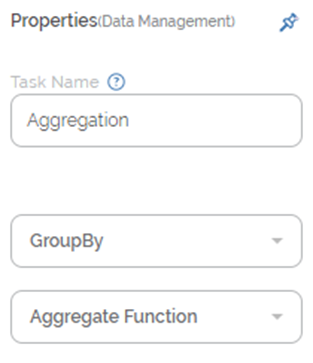
The available properties of Aggregation are as shown in the figure given below.
The table given below describes different fields present on the properties of Aggregation.
Field | Description | Remark |
|---|---|---|
Task Name | It displays the name of the selected task. | You can click the text field to edit or modify the name of the task as required. |
GroupBy | It allows you to select the function for which you want to group the data. |
|
Aggregate Function | It allows you to select the type of data that is to be aggregated. |
|
Interpretation from Aggregation
The aggregation algorithm can be used on either the numerical data or the categorical data. The table given below describes the results for Aggregation.
Aggregation Method | Result | Remark |
|---|---|---|
Sum | It gives the aggregation of the given data by the sum of the values in that column. | It can be performed only on numerical data. |
Mean | It gives the aggregation of the given data by mean of the values in that column. | It can be performed only on numerical data. |
Mode | It gives the aggregation of the given data by mode of the values in that column. | It can be performed only on numerical data. |
Minimum | It gives the aggregation of the given data by the minimum value of the variable in that column. | It can be performed on numerical as well as categorical data. |
Maximum | It gives the aggregation of the given data by the maximum value of the variable in that column. | It can be performed on numerical as well as categorical data. |
Count | It gives the aggregation of the given data by the count of the variable in that column. | It can be performed on numerical as well as categorical data. |
Standard Deviation | It gives the aggregation of the given data by the standard deviation of the variable in that column. | It can be performed only on numerical data. |
Variance | It gives the aggregation of the given data by the variance of the variable in that column. | It can be performed only on numerical data. |
Example of Aggregation
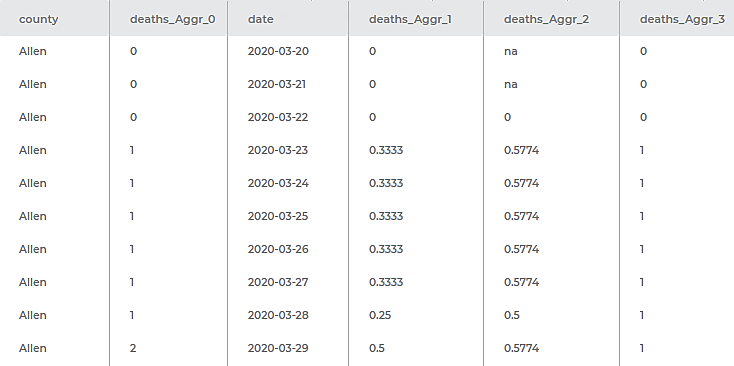
The figure given below displays the output of aggregation performed on sample data. The data of the number of deaths (numerical data) in a US county is aggregated by sum, mean, standard deviation, and the maximum value of the number of deaths. The data is grouped by the name of the county and date (both categorical data).
Field | Result |
|---|---|
county | It displays the name of the US county whose data corresponding to the number of deaths is aggregated. |
deaths_Aggr_0 | It displays the aggregate deaths in that county by the sum of deaths on a particular date. |
date | It displays the date corresponding to which the data is aggregated. |
deaths_Aggr_1 | It displays the aggregate deaths in that county by the mean number of deaths on a particular date. |
deaths_Aggr_2 | It displays the aggregate deaths in that county by the standard deviation of the deaths on a particular date. |
deaths_Aggr_3 | It displays the aggregate deaths in that county by the maximum value of the number of deaths on a particular date. |
Table of Contents


