The different tests available in Time-series Data Preparation under Forecasting are given below.
- Accumulation
- Missing Value
- Transformation
- Differencing
| Data Preparation | |||
Description |
| ||
Why to use | To impute missing values in the time-series data. | ||
When to use | For analysis of time-series data without losing its variation. | When not to use | When data do not contain any missing values. |
Prerequisites | The time interval for the data to be analyzed should be specified. | ||
Input | Time-series data with fixed time intervals or time-series data. | Output | A complete time-series data for the specified time interval having no missing values. |
Statistical Methods used |
| Limitations |
|
Functions of the Missing Value Test
The table given below describes the functions of the Missing Value test.
Function | Description | Remark |
|---|---|---|
Mean | It replaces the missing values with the mean of the non-missing values within each column separately and independently from the others. |
|
Median | It replaces the missing values with the median of the non-missing values within each column separately and independently from the others. |
|
Min | It replaces the missing values with the minimum value present in that column. | – |
Max | It replaces the missing values with the maximum value present in that column. | – |
Remove | It discards the rows that contain missing values. |
|
Constant | It replaces the missing values with the constant value that you have entered. |
|
Random | It replaces the missing values with random values from that column. |
|
Forward Fill | It fills the missing value with the preceding value from the dataset. | For example, the number of people on Tuesday is missing in the time-series data. In this case, the Monday count becomes the Tuesday data. |
Backward Fill | It fills the missing value with the succeeding value from the dataset. | For example, the number of people on Tuesday is missing in a time series data. In this case, the Wednesday count becomes the Tuesday data. |
Interpolate | Using some pre-defined algorithms, it replaces the missing value by interpolating the existing values linearly in the dataset. | For example, the data points for twelve months are present in the time-series data, and the next value for the thirteenth month is missing. In this case, the twelve values are interpolated, and the value for the thirteenth month is calculated. |
Example of Time-series Data Preparation
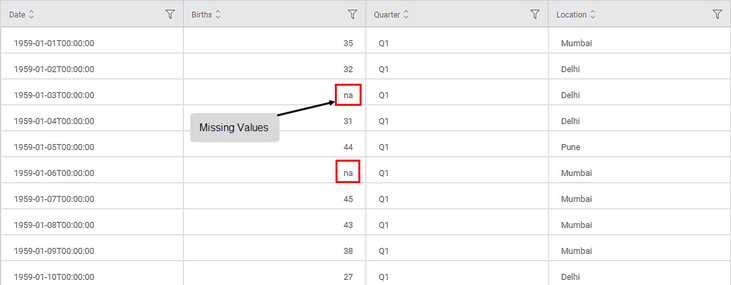
Consider an example of Female Birth Rate time-series data. Here, the variable Date is of interval type. The dataset containing some missing values (na) is shown in the figure below.
In the Properties pane, the values are selected as below.
Time ID Variable | Date |
Target Variable | Births |
Group By | Quarters |
Interval | Week |
Time Format | 12/13/1947 |
Start Time | None |
End Time | None |
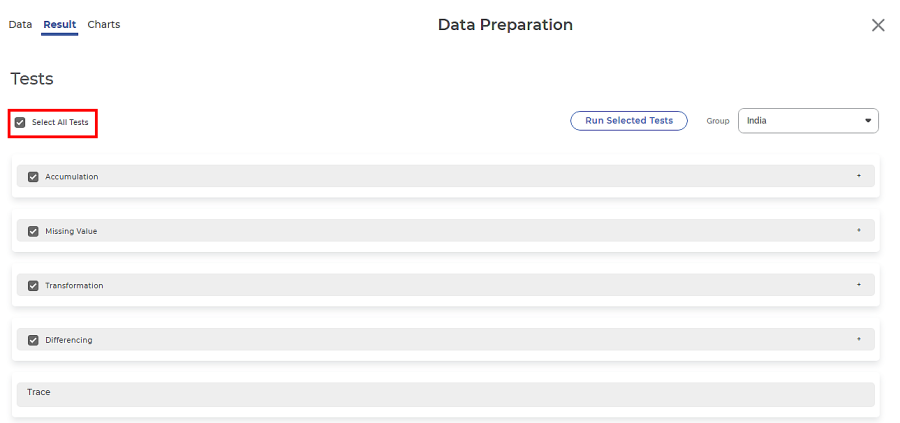
We apply Data Preparation on the above data. On the Result page, you can see Group as Q1.
|
|
When you click Run Selected Tests, the tests are performed based on the default function and values in the fields corresponding to each test. The result for each test is displayed in the figures given below.
Interpretation of Result of Missing Value Interpretation
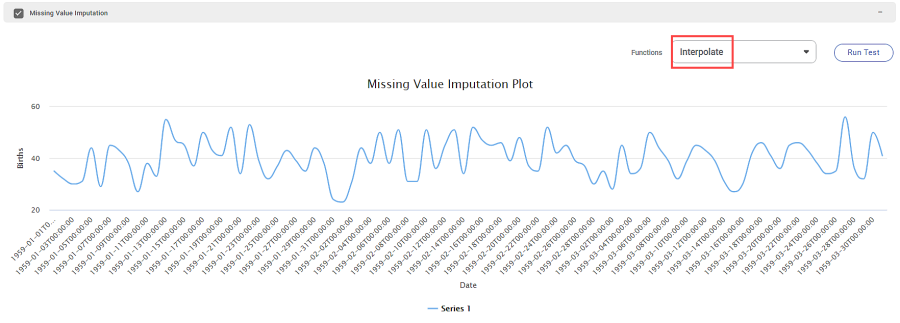
Forward Fill is selected as the Function for plotting the Missing Value Imputation Plot. Thus, the missing data points in the selected Group (Q1) are filled from the previous values, and the corresponding graph is created.
In the above figure, the Missing Value Imputation plot displays the monthly number of Births in the time-series data. The Interpolated values of Births impute the missing values in quarter Q1.
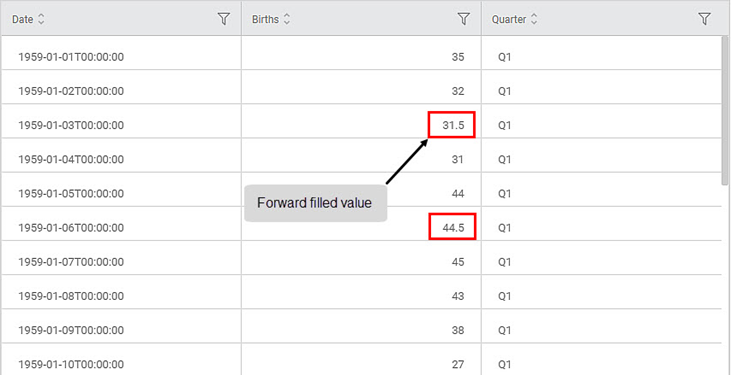
In the Data tab, the table shows the forward-filled values. The values 32 and 29 from the previous data points are forward filled in place of the na values.
Table of Contents


