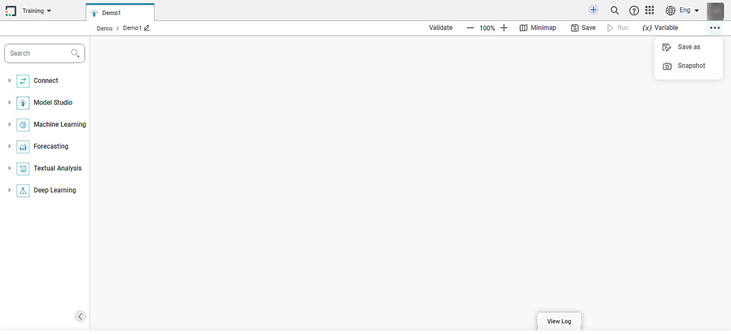
The workbook canvas is the area where you can build algorithm flows. When you open a new workbook, the following icons and fields are displayed.
The workbook screen has four panes, as given below.
- Task Pane: This pane displays the datasets and algorithms that can be used in the workbook.
- Function Pane: This pane displays the various functions that can be performed on the workbook.
- Workbook Canvas: This is the work area where you can drag-and-drop algorithms and datasets to create algorithm flows.
- VIEW LOG: This tab tracks the activities performed in the workbook and keeps a log (track) of it.
The table given below describes the fields and icons present on the Workbook Canvas.
Icon/Field | Description | |
|---|---|---|
Task pane | It displays the list of datasets and algorithms that can be used in the workbook. | |
Name of the workbook | It displays the title of the workbook. | |
| Validate |
|
Zoom | It helps to magnify the canvas to view detailing or move further away to take an overview look of the canvas. | |
Minimap | It displays a scaled down version of the workbook. | |
Save | It saves your workbook. | |
Save As |
| |
Run | It runs the created algorithm flow. | |
Hyperparameters | It is set of values of the algorithm properties at which the algorithm gives best results. | |
| (x) Variable | It is used anywhere in the workbook or workflow. | |
Snapshot | It takes the snapshot of the created algorithm flow. The snapshot can be restored later for version control. | |
Workbook Canvas | It is the area to experiment with your datasets and algorithms. You can use the drag-and-drop method to insert datasets and algorithms in the workbook canvas. | |
VIEW LOG | It displays the logs of the algorithm flow that are run, along with the trace of algorithm properties. |

