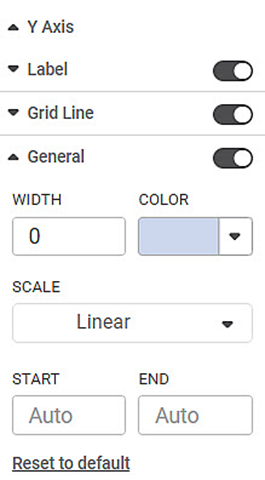
General settings are associated with the line which is used to represent the Y-axis.
The table given below describes different fields present in General formatting on Y-axis.
Field | Description | Remark |
|---|---|---|
Width | It allows you to select the width of the line used to represent the Y-axis. | The default width selected is zero. |
Color | It allows you to select the color of the line used to represent the Y-axis. | — |
Scale | It allows you to select the scale in which the variable represented on the Y-axis is plotted | You can select one of the following scale options
|
Start | It allows you to select the initial coordinate value at the origin from where the Y-axis starts. | By default, the setting of the starting coordinate is Auto. It means that the coordinate is selected from the data values that we are plotting. |
End | It allows you to select the final coordinate value up to which the variables on Y-axis are plotted. | By default, the setting of the ending coordinate is Auto. |
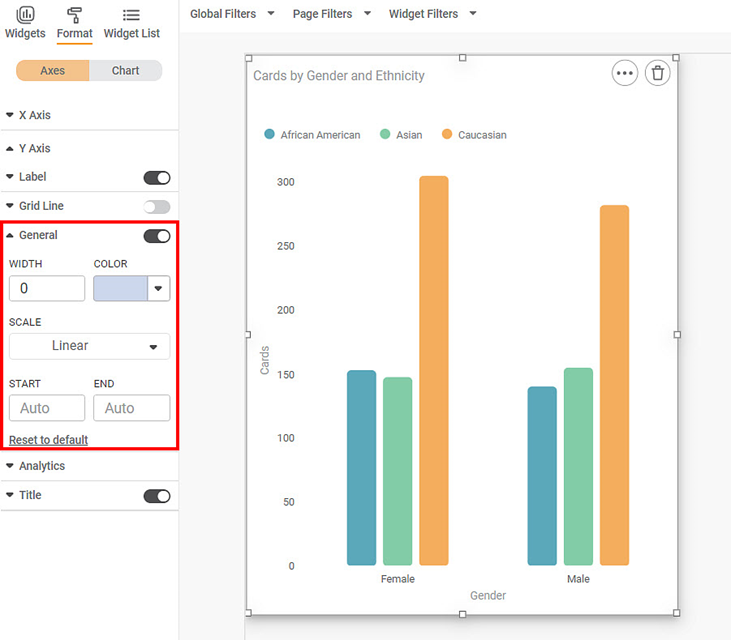
To use General formatting options, first plot a Column Chart using the dimensions and measures from the dataset. For example, we plot a Column Chart of the Count of Cards against Gender. The Ethnicity of the sample is the Legend dimension.
The figure given below shows an original image of the Column Chart. By default,
- The width of the Y-axis is zero, that is, the axis is not visible on the plotted chart.
- The scale selected is Linear.
- The starting and ending coordinates on the Y-axis are auto-selected. In the figure, the starting and ending coordinates on the Y-axis are zero (0) and 120 respectively.
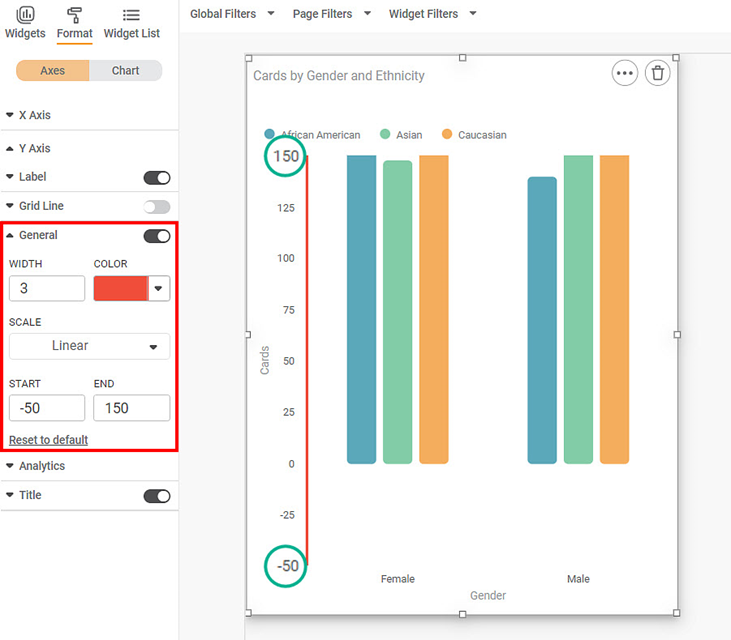
Now, change the
- Width of the Y-axis line
- Color of the Y-axis line
- Starting and Ending coordinate of the Y-axis line. Here we choose -50 and 150 respectively.
The resultant widget is shown below.
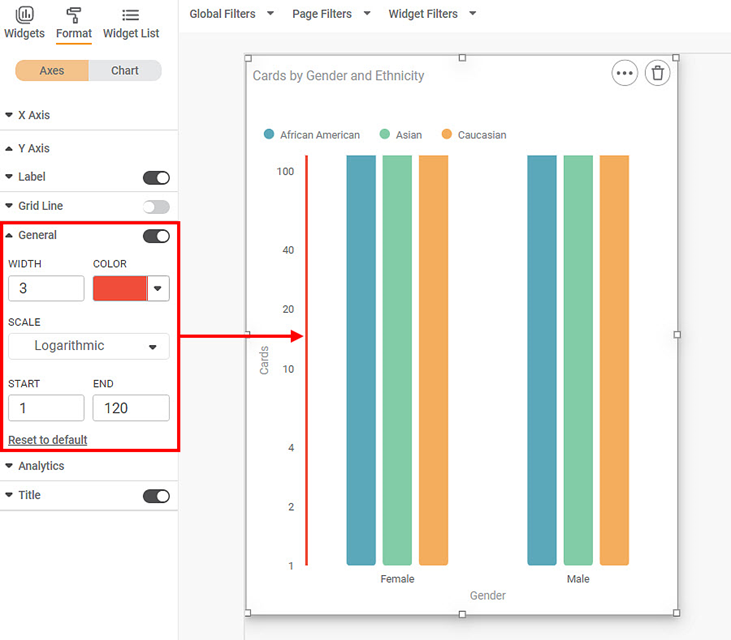
Now, change the
- Y-axis scale to Logarithmic.
- Starting and Ending coordinate of the Y-axis line. Here we choose 1 and 120 respectively. [Since log (0) = 1, the logarithmic scale starts from one (1) if the linear scale starts from zero (0).]
The resultant widget is shown below.


