The Merge same values option allows you to merge rows containing same values for the selected dimension.
This option is available under Column option in Table, Cross Table, and Sparkline charts and is visible only after you select a column.
| This functionality works only when same values occur in consecutive rows. |
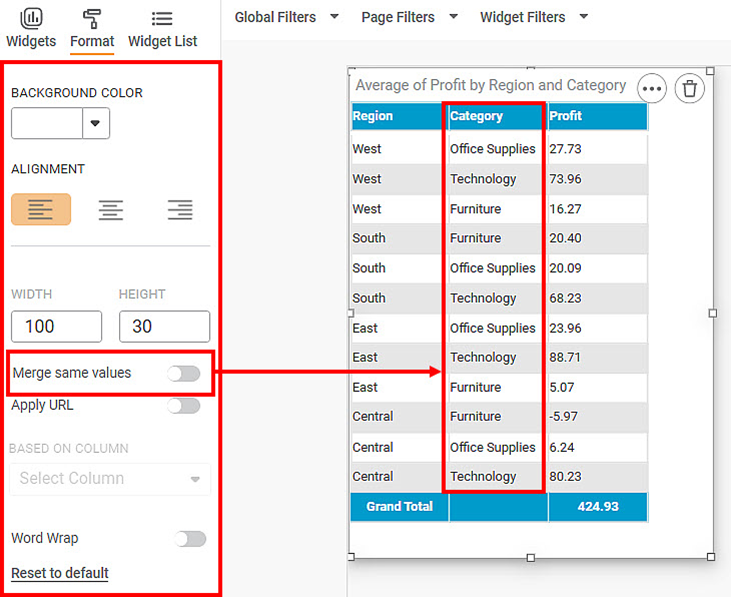
To use Merge same values formatting options, first plot a Table or Cross Table chart using the measures from the dataset. For example, we plot a Table Chart of Region and Item.
The figure given below shows an original image of the Table Chart.
Now,
- Select Region column
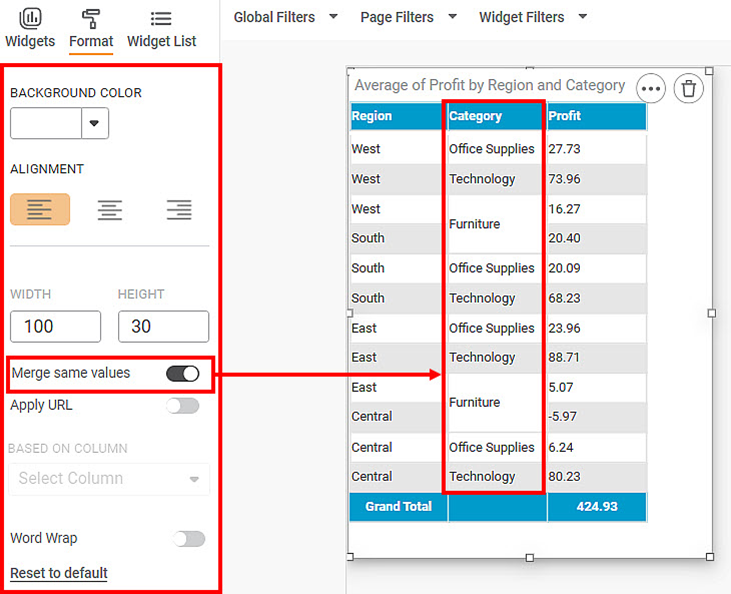
- Turn the Merge same values toggle ON
The resultant widget is shown below.


