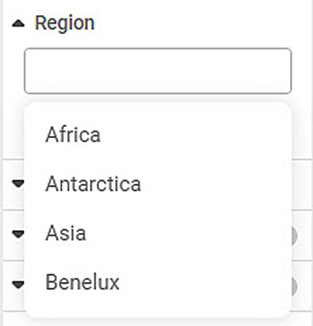
The Region formatting option is available in Map chart.
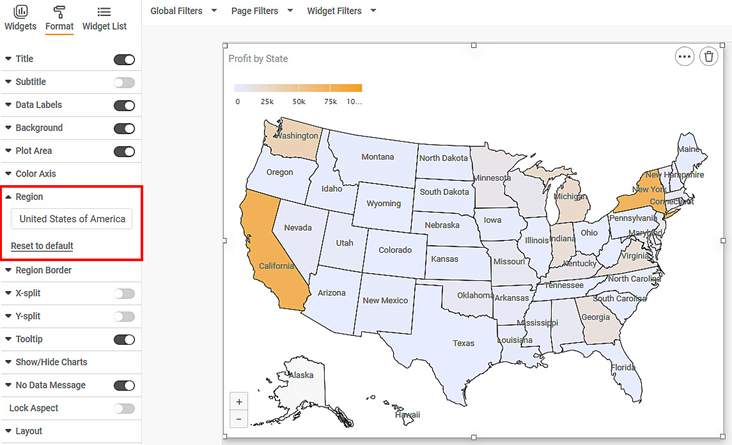
To use the Region formatting options, first plot a Map chart.
For example, we plot a Map Chart of Population by Region.
The figure given below shows an original image of the Map Chart.
Now,
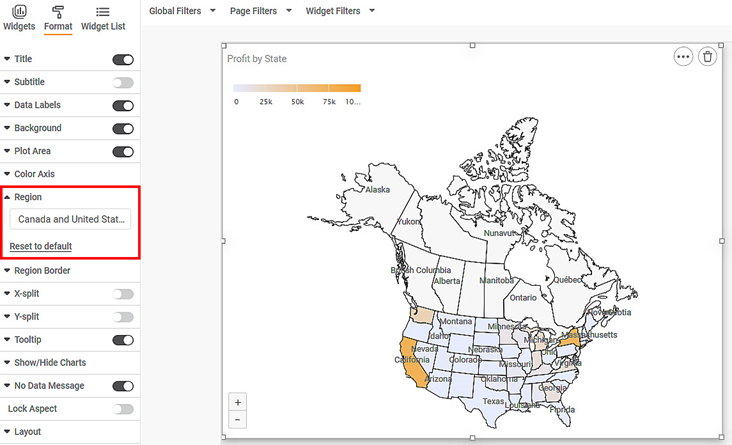
Select Region as Canada and United States of America.
The resultant widget is shown below.


