`Dashboards help visualize your data from an extraordinary perspective. The same data, when explored using different visualization charts, can give diverse insights. These insights accelerate the decision-making process. In RubiSight, dashboards can be created very easily, using the following steps:
- Start with a blank dashboard
- Add your dataset to the dashboard
- Select a chart/widget of your choice
- Configure the chart/widget
This section demonstrates the basic dashboard creation process. To create a dashboard, and add a widget to it, follow the steps given below.
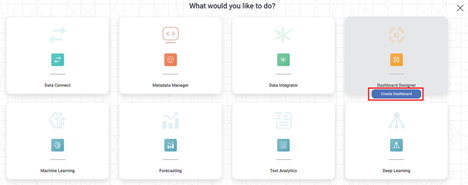
- On the home page, click the Create icon ( ).
- Hover over the Dashboard Designer tile and click the Create Dashboard button.
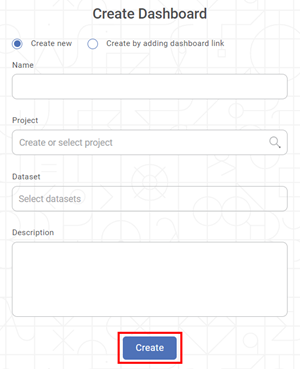
The Create Dashboard page is displayed. - Select the Create new radio button.
- Enter the Name for your dashboard.
Enter the name in the Project field to create a new project.
Notes- The dashboard is created under the entered project name.
- You can also type the name of the existing project in the Project field to select the project.
- The project name is mandatory.
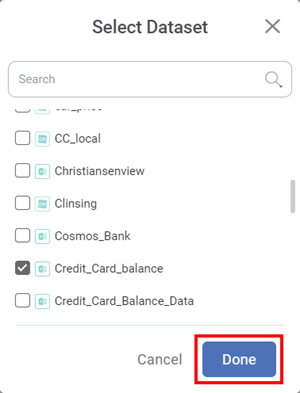
- Click Select Dataset in the Dataset field. The Select Dataset window is displayed.
Locate the dataset you want to add and select its corresponding check box.
Notes- You can also type the name of the dataset in the Search field to locate the dataset.
- You can select multiple datasets.
- After selecting all datasets, click Done.
- Enter Description for your dashboard.
- Review all fields and click Create.
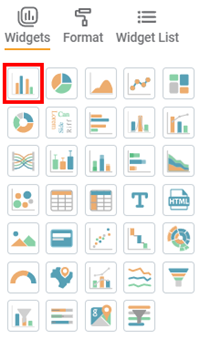
The dashboard is created, and the dashboard canvas is displayed. Next, we plot a chart using the widgets available. In the WIDGETS pane, click the widget you want to plot.
Note:Hover over any widget to see its name and the number of dimensions and measures in it.
The selected widget is added to the dashboard canvas.
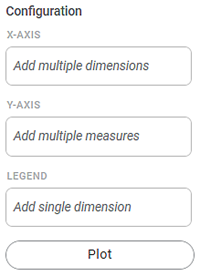
Select the added widget. For example, here we consider a Column Chart. Configuration settings are displayed in the WIDGETS pane.
Notes:- You can add multiple widgets on one canvas.
- The Configuration setting varies depending on the selected chart.
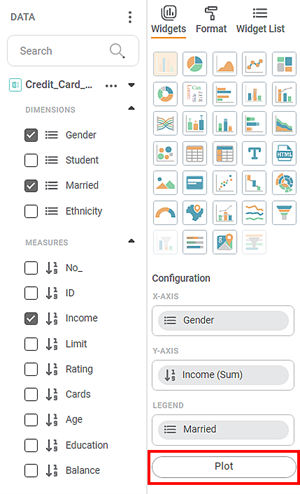
- From the DATA pane, drag-and-drop the DIMENSIONS and MEASURES in the appropriate Configuration fields, and then click Plot.
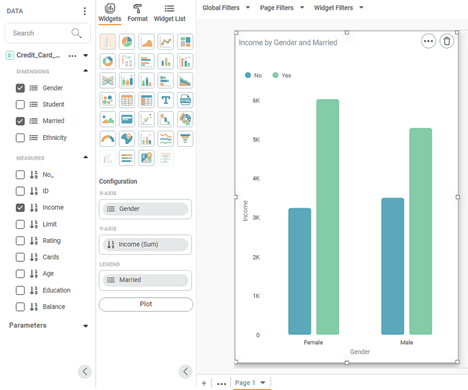
For example, here, we did drag-on-drop for Gender in X-Axis, Income in Y-Axis, and Married in Legend.
The chart is plotted depending upon the dimensions and measures added in the configuration. The dashboard looks as shown in the diagram below.
Here we included only one chart – the Column Chart. RubiSight supports multiple types of widgets to create charts. The next section briefly explains each of these widgets.
For more information about the widgets, refer to RubiSight Widget Reference Guide.
