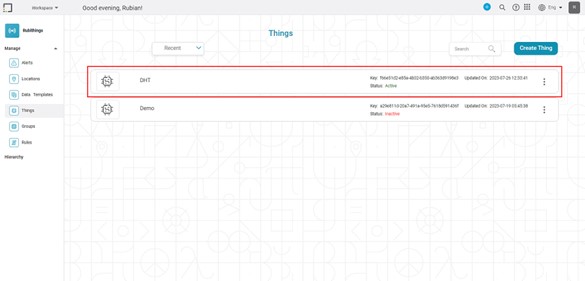
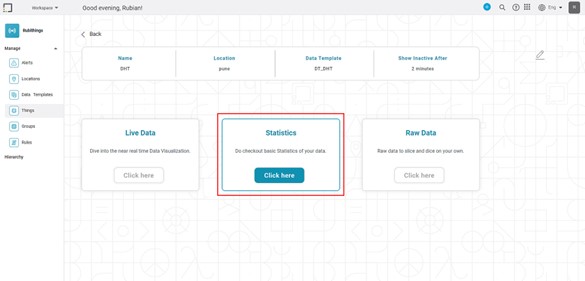
In Rubithings, after commissioning a thing, the basic statistics can be viewed by clicking on the thing. There are three types of data gadgets present.
Field | Description |
Live data | It visualizes the live data |
Statistics | It gives the basic statistics of your data |
Raw data | It gives the raw data |
Steps to view the basic statistics
- Go to Rubithings Homepage
- Select the ‘Things’ option from the ‘Manage’ section.
- Click on the active thing whose statistics you want to view.
- Click on ‘Statistics’
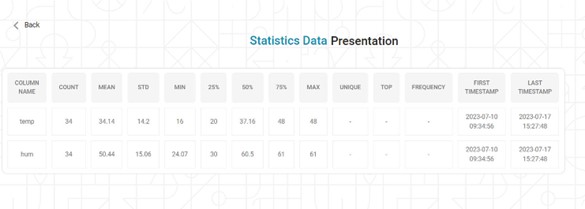
The following statistics are shown.
The following table shows the description of each column in the above tableField Name
Description
Column_name
It contains the name of the column.
Count
It gives the number of data packets received for a data column.
Mean
It Gives the mean value of each data column.
STD
It gives the standard deviation of each data column.
Min
It gives the minimum value of each data column.
25%
25% of each data column
50%
50% of each data column
75%
75% of each data column
Max
It gives the maximum value of each data column.
Unique
It displays what is represented by a Boolean value for all data columns. It is only applicable to the Boolean type of data.
Top
It denotes the Boolean value occurring most frequently for all data columns.
Frequency
It denotes the frequency of the Boolean value occurring most frequently for all data columns.
Timestamp_Unique
It displays the number of times the data is collected uniquely for each data column.
First_Timestamp
It represents the first time and date at which the data is collected after commissioning the thing for each data column.
Last_Timestamp
It indicates the date and time of the most recent data collection since the thing was commissioned for each data column.


