Hyperparameter Optimization in Adaboost
Hyper Parameter Optimization is used for better Optimization of a given dataset. This feature provides you with a list of parameters that give the best solution for your dataset, among the parameters provided for optimizing the solution. You can select more than one parameter from the list.
Note: |
|
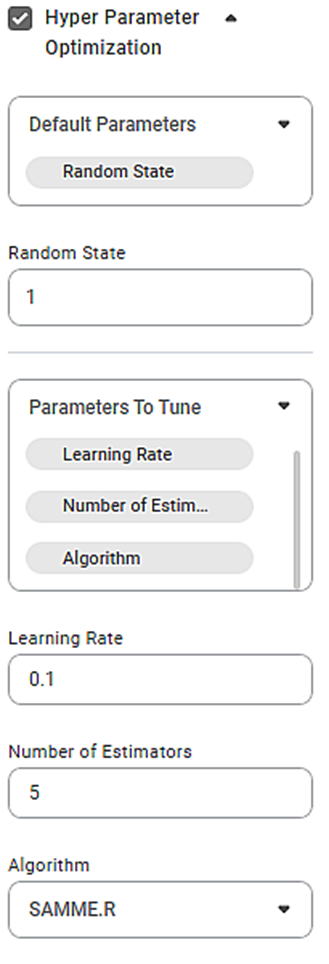
The figure below shows various selections of parameters and other properties for Hyperparameter Optimization in Adaboost.
While selecting various parameters, note that,
- You can select anyone, multiple, but NOT ALL variables as default parameters from the Default Parameter drop-down. If you select all the variables, then you get a validation error for the selection.
- You can choose not to select any variable as the default parameter.
- After you select the default parameter(s), the remaining parameters appear for selection in the Parameter To Tune drop-down.
- You can select all variables in the Parameters To Tune options. In this case, there are NO variables selected as Default Parameters.
- If a variable is selected as default parameter, the same cannot be selected for tuning. If you select it for tuning, the parameter is removed from the default parameter selection.
- You can select any number of values for all the variables. The values should be entered in the appropriate boxes with a comma separating two values.
We select the following values for parameters and properties.
Default Parameter | Random State |
Random State | 1 |
Parameters to Tune |
|
Learning Rates | 0.1, 0.2, and 0.3 |
Number of Estimators | 30, 40, and 50 |
Algorithms | SAMME.R |
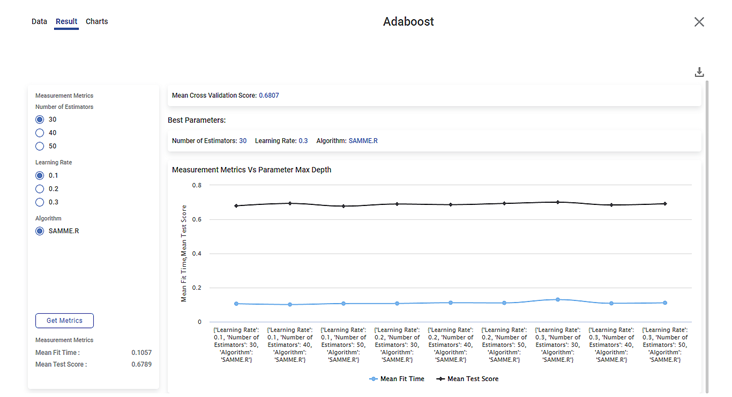
The figure below shows the results of Hyperparameter Optimization in Adaboost.
Inferences:
- The Result page shows
- Measurement Metrics
- Best parameters
- Graphical representation of the variation of Measurement Metrics against Parameter Maximum Depth.
- For example, when Number of Estimators = 30, Learning Rate = 0.1, and Algorithm = SAMME.R,
- Mean Fit Time = 0.1057
- Mean Test Score = 0.6789
- Mean Cross Validation Score = 0.6807
- Best parameters:
- Number of Estimators = 30
- Learning Rate = 0.3
- Algorithm = SAMME.R
- You can change the selected values and get new Measurement Metrics by clicking the Get Metrics button.
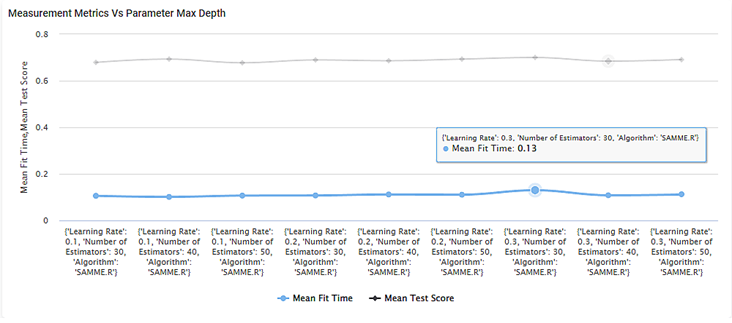
- The graph contains two curves for
- Mean Fit Time
- Mean Test Score
- The two curves are plotted considering all possible combinations of the Number of Estimators, Learning Rates, and Algorithms.
- When you hover over any point on the graphs, you can see the mean fit time or mean test score for a given combination of the above three values.
- For example, the mean fit time is 0.13 for a learning rate of 0.3, the number of estimators equal to 30, and the SAMME.R algorithm.
Note: |
|
Hyperparameter Optimization in Support Vector Machine
Hyper Parameter Optimization is used for better Optimization of a given dataset. This feature provides you with a list of parameters that give the best solution for your dataset, among the parameters provided for optimizing the solution. You can select more than one parameter from the list.
Note: | To activate the Hyperparameter Optimization selection, select the corresponding checkbox. |
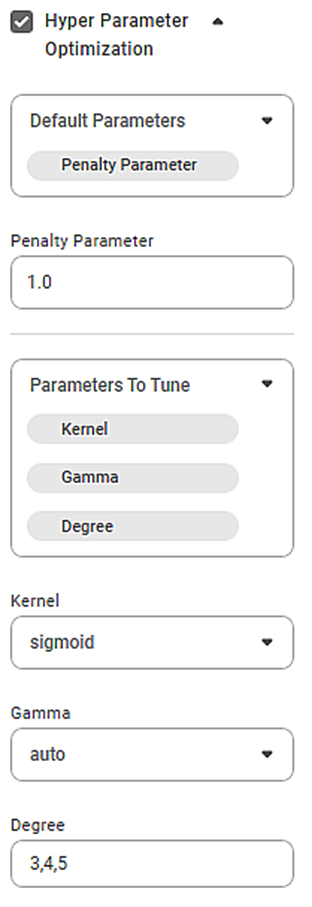
The available properties for Hyperparameter Optimization in Support Vector Machine are as shown in the figure below.
While selecting various parameters, note that,
- You can select anyone, multiple, but NOT ALL variables as default parameters from the Default Parameter drop-down. If you select all the variables, then you get a validation error for the selection.
- You can choose not to select any variable as the default parameter.
- After you select the default parameter(s), the remaining parameters appear for selection in the Parameter To Tune drop-down.
- You can select all variables in the Parameters To Tune options. In this case, there are NO variables selected as Default Parameters.
- If a variable is selected as default parameter, the same cannot be selected for tuning. If you select it for tuning, the parameter is removed from the default parameter selection.
- You can select any number of values for all the variables. The values should be entered in the appropriate boxes with a comma separating two values.
- The fields for entering the values for these parameters are displayed accordingly below the two dropdowns.
We select the following values for parameters and properties.
Default Parameter | Penalty Parameter |
Penalty Parameter | 1.0 |
Parameters to Tune | Kernel |
Kernel | rbf, poly, linear, and Sigmoid |
Gamma | scale, and auto |
Degree | 3, 4, and 5 |
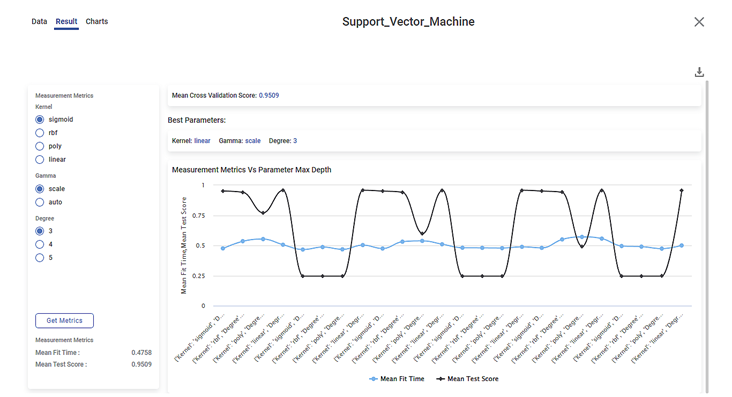
The figure below shows the results of Hyperparameter Optimization in Support Vector Machine.
Inferences:
- The Result page shows
- Measurement Metrics
- Best parameters
- Graphical representation of the variation of Measurement Metrics against Parameter Maximum Depth.
- For example, when Kernel = sigmoid, Gamma = scale, and Degree = 3,
- Mean Fit Time = 0.4758
- Mean Test Score = 0.9509
- Mean Cross Validation Score = 0.9509
- Best parameters:
- Kernel = linear
- Gamma = scale
- Degree = 3
- You can change the selected values and get new Measurement Metrics by clicking the Get Metrics button.
- The graph contains two curves for
- Mean Fit Time
- Mean Test Score
- The two curves are plotted considering all possible combinations of the Kernel, Gamma, and Degree values.
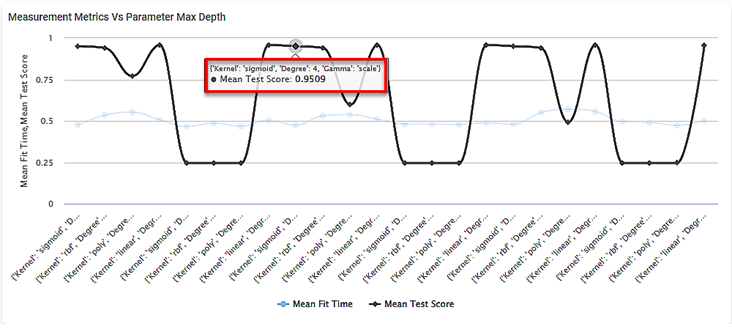
- When you hover over any point on the graphs, you can see the mean fit time or mean test score for a given combination of the above three values.
- For example, the mean test score is 0.9509 for the sigmoid kernel, Gamma equal to scale and a degree of four (4).
Note: |
|
Table of contents
