Centroid Based Clustering | |||||
Description | In Centroid Based Clustering, a central vector represents each cluster. The objects are assigned to the clusters such that the squared distance between the object and the central vector is minimized. | ||||
Why to use | To convert textual data to its numerical form. | ||||
When to use |
| When not to use |
| ||
Prerequisites | Input data should be of text type and should not contain special characters and numbers. | ||||
Input | Textual Data | Output | Data divided into clusters | ||
Statistical Methods used |
| Limitations |
| ||
Centroid Based Clustering is located under Textual Analysis () in Clustering, in the left task pane. Use the drag-and-drop method to use the algorithm in the canvas. Click the algorithm to view and select different properties for analysis.
Refer to Properties of Centroid Based Clustering.
In Centroid-based clustering, each cluster is represented by a central vector. The central vector may not necessarily be a part of the dataset. A data value is assigned to a cluster depending upon its proximity, such that its squared distance from the central vector is minimized.
The k-means algorithm is the most widely used centroid-based clustering algorithm. In this algorithm, the dataset is divided into k pre-defined, distinct, and non-overlapping clusters. Each data point is assigned to a cluster such that the arithmetic means of all data points within a cluster is always minimum. Minimum variation within a cluster ensures greater homogeneity of data points within that cluster.
Properties of Centroid Based Clustering
The available properties of Centroid Based Clustering are as shown in the figure given below.
The table given below describes the different fields present on the properties of Centroid Based Clustering.
Field | Description | Remark | |
Task Name | It is the name of the task selected on the workbook canvas. | You can click the text field to edit or modify the name of the task as required. | |
Independent Variables | It allows you to select Independent variables. |
| |
Number of Clusters | It allows you to enter the number of clusters you want to create. | The default value is 8. | |
Advanced | Method for Initialization | It allows you to select the initialization method. | The available options are k means and random. |
Number of Runs | It allows you to enter the number of times the k-means algorithm will be run with different centroid seeds. | The recommended value is 10. | |
Random State | It allows you to enter the value that helps to create clusters. | This parameter is optional. | |
Number of Iterations | It allows you to enter the number of times the k-means algorithm will be run with the same centroid seed. | The recommended value is 10. | |
Dimensionality Reduction | It allows you to select the method for dimensionality reduction. |
| |
Example of Centroid Based Clustering
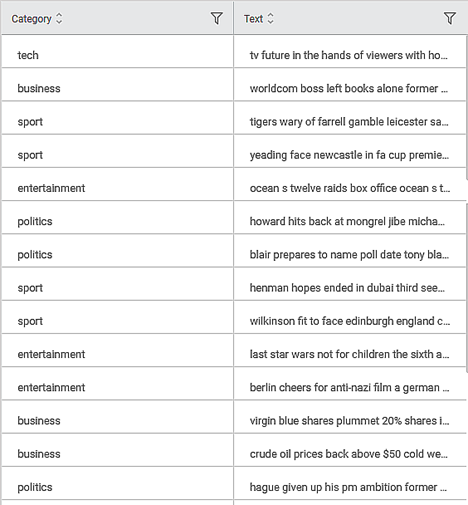
Consider a textual dataset of musical instruments review. A snippet of input data is shown in the figure given below.
We select the following properties and apply Centroid Based Clustering.
Number of Clusters – 8
Method of Initialization – k-means
Number of Runs – 10
Number of Iterations – 300
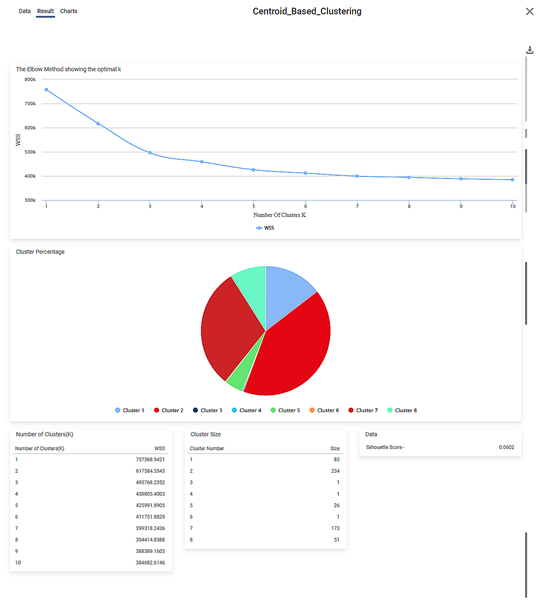
The result page is displayed in the figure given below.
Table of Contents


