Sorting | ||||||
Description | Sorting of numerical data involves the arrangement of data points either in ascending or descending order. | |||||
Why to use | Numerical Analysis – Data Preparation | |||||
When to use | When you want to arrange the numerical data in a particular order. | When not to use | On textual data and categorical data. | |||
Prerequisites | It should be used on numerical data. | |||||
Input | Any dataset that contains disordered numerical data | Output | Sorted numerical data | |||
Statistical Methods used |
| Limitations | - | |||
Sorting is located under Model Studio ( ) in Data Preparation, in the task pane on the left. Use drag-and-drop method to use the algorithm in the canvas. Click the algorithm to view and select different properties for analysis.
Refer to Properties of Sorting.
In Sorting algorithm, the given numerical data is arranged either in the ascending or the descending order.
Properties of Sorting
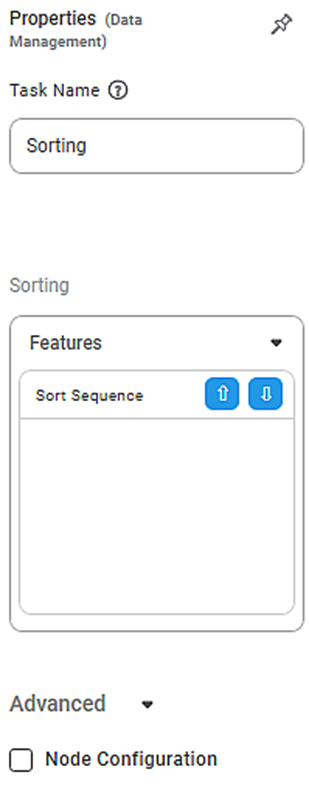
The available properties of Sorting are as shown in the figure given below.
The table given below describes different fields present on properties of Sorting.
Field | Description | Remark |
|---|---|---|
Task Name | It displays the name of the selected task. | You can click the text field to edit or modify the name of the task as required. |
Features | It allows you to select the feature to sort the data. |
|
Sort Sequence |
|
|
Interpretation from Sorting
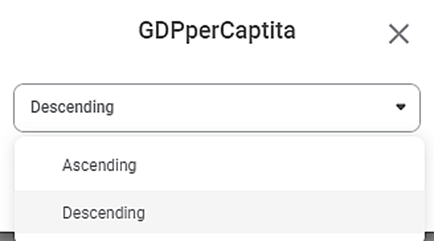
The orders in which the data can be sorted are shown below. The selected numerical data can be sorted in ascending or descending order. To change the sorting order, hover over the selected feature and click the gear icon.
Then, select one of the options from Ascending and Descending.
The table given below describes the results for sorting.
Sorting | Result | Remark |
|---|---|---|
Ascending | It arranges the given data in ascending (increasing) order of values. | The sorting order is selected as ascending by default. |
Descending | It arranges the given data in descending (decreasing) order of values. | — |
Example of Sorting
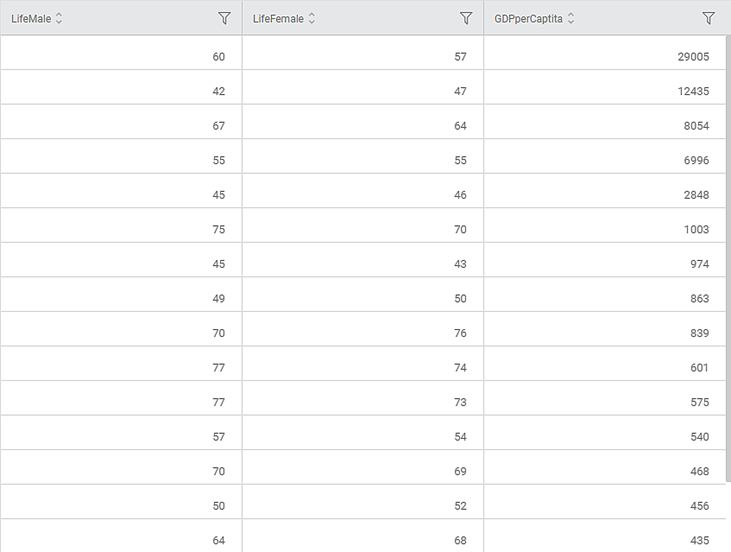
In the example given below, the social indicators from the United Nations Social Statistics data are sorted either in the ascending or the descending orders. It displays the variables along with the order of sorting. Only the GDPperCapita data has been sorted in the descending order.
The figure given below displays the input data which is not sorted.
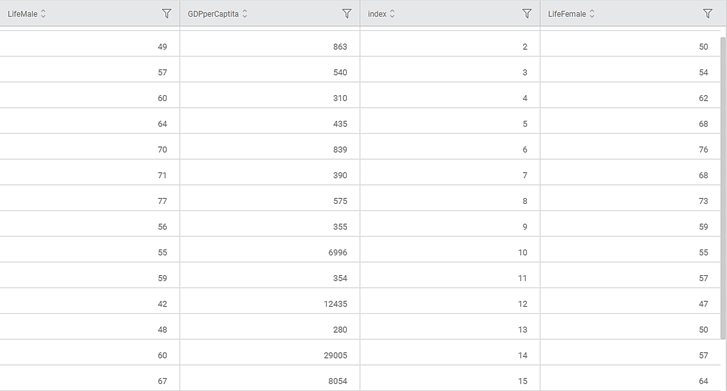
After using the Sorting algorithm, the following result is displayed. We choose the GDPperCapita column to be sorted in the descending order.
The figure given below displays the output data obtained by sorting. Only the GDPperCapita data is seen to be arranged in the descending order.
Table of Contents
