Cross Validation | |||||
Description | The dataset is divided randomly into a number of groups called k folds. Each fold is considered training data during each iteration, and the remaining folds are considered test data. This is repeated until each of the folds are considered as test data. | ||||
Why to use |
| ||||
When to use |
| When not to use | A sufficient amount of data is available to train the model. | ||
Prerequisites | |||||
Input | A dataset that contains any form of data – Textual, Categorical, Date, Numerical. | Output | The dataset split into k folds. | ||
Statistical Methods used |
| Limitations |
| ||
Cross Validation is located under Model Studio () under Sampling, in Data Preparation, in the left task pane. Use the drag-and-drop method to use the algorithm in the canvas. Click the algorithm to view and select different properties for analysis.
Refer to Properties of Cross Validation.
Cross Validation is a resampling technique used to evaluate the accuracy of the model. It is used mainly when the available input data is limited.
The dataset is divided into a number of groups called k folds. Hence, the process is generally called k-fold cross-validation.
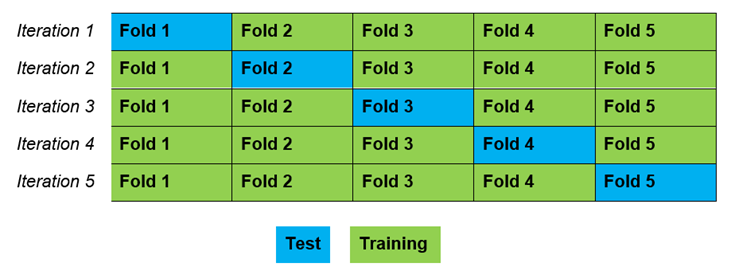
Consider that k = 5. It means that, the dataset is divided into five equal parts. After division, the steps mentioned below are executed five times, each time with a different holdout set.
- The dataset is shuffled randomly.
- The dataset is split into five folds (k = 5).
Each fold would be considered as training data in each iteration. The remaining folds are considered as test data.
In the first iteration, data is split into five folds - fold one is train data, and the other are test data.
This is repeated until each of the five folds are considered as test data.
As this technique involves an iteration process, data used for training in one iteration is used for testing in the next iteration.
Properties of Cross Validation
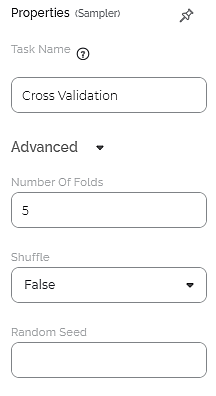
The available properties of Cross Validation are as shown in the figure given below.
The table given below describes the different fields present on the properties of Cross Validation.
Field | Description | Remark |
|---|---|---|
Task Name | It is the task selected on the workbook canvas. | You can click the text field to edit or modify the name of the task as required. |
Number Of Folds | It allows the dataset to be split into the given number of folds. | — |
Shuffle | It allows you to select whether or not to shuffle the input data while creating the different folds. | Its values are either True or False. True: The data is shuffled before splitting into folds. False: The data is not shuffled before splitting into folds. |
Random Seed | It is the value that builds a pattern in random data. This ensures that the data is split in the same pattern every time the code is re-run. | — |
Interpretation of Cross Validation
Cross Validation can be applied to any dataset. You can apply any of the Classification or Regression models on the output obtained from Cross Validation.
The value of k should be chosen carefully to avoid misrepresentation of the data.
The value of k is chosen as mentioned below:
- Representative - The value for k is selected such that each train and test datasets are sizeable enough to accurately represent the original dataset.
- K = 10 - It has been found through experimentation that the value for k fixed to 10 generally results in a model with low bias.
- K = n - The value for k is fixed to ‘n’, where n is the size of the dataset such that each test sample is used in the held-out dataset at least This approach is called Leave-one-out Cross Validation.
Example of Cross Validation
Consider a flower dataset with 150 records. A snippet of input data is shown in the figure given below.
We apply Cross Validation to the input data. The output of Cross Validation is given as input to the Regression model, Ridge Regression.
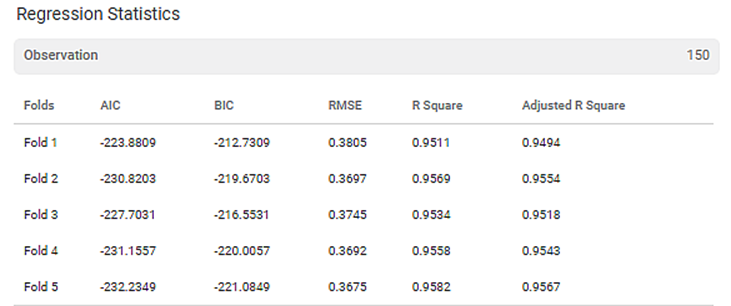
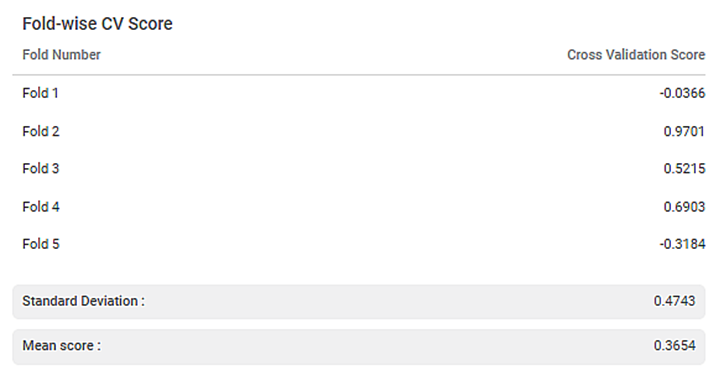
The result displays the Regression Statistics for each of the folds, as shown in the figure below.
The final score for each of the different metrics on complete data is also displayed.
The result also displays Fold-wise Cross Validation (CV) Score, Standard Deviation, and Mean Score of all the CV scores.
Similarly, you can use Train Test Split and test any other Classification or Regression models' performance.
Table of Contents
