Outlier Detection | |||||
Description | Outlier Detection reveals the extreme values that deviate from the rest of the data in a real-world dataset. | ||||
Why to use | Numerical Analysis – Data Preparation | ||||
When to use | When there are certain values in the data which significantly deviate from the rest of the data. | When not to use | On textual data. | ||
Prerequisites | It should be used on numerical data. | ||||
Input | Dataset with extreme values. | Output | Dataset with extreme values either removed or imputed with mean, median, or mode. | ||
Statistical Methods used |
| Limitations | - | ||
Outlier Detection is located under Model Studio ( ) in Data Preparation, in the task pane on the left. Use drag-and-drop method to use algorithm in the canvas. Click the algorithm to view and select different properties for analysis.
Refer to Properties of Outlier Detection.
An outlier is a data value that is unlike the rest of the data. It is rare, or distinct, and does not fit in with the rest of the data.
There are many ways data can end up with outliers. For example,
- In case of consumer data for an e-commerce site, there might be very few customers buying products in huge quantity.
- In case of average mortality rate, there could be very few people who live beyond 100 years of age.
Most algorithms (including scikit-learn) will give you incorrect results if there are outliers present in the data. That is because, these estimators assume that all values fall in a particular range. So, it is recommended to use the Outlier Detection method to identify these rare and extreme values. This detection and correction of outliers helps to generate a uniform dataset.
There are multiple outlier detection methods available. Few of them are listed below.
- Standard Deviation Method
- Interquartile Range Method
- Automatic Outlier Detection
In rubiscape, we use Interquartile Range Method to detect outliers.
Outlier Detection Methods in rubiscape
The outlier detection methods in rubiscape are listed below.
- Outside of 1.5 IQR Rule – Any value which is more than 1.5*IQR (1.5 times of IQR) above the third quartile or below the first quartile is considered as an outlier.
- Outside of 5th and 95th Percentile Range –
Any value below the 5th percentile and above the 95th percentile of the dataset is considered as an outlier.
- Outside of 2nd and 98th Percentile Range – Any value below the 2nd percentile and above 98th percentile of the dataset is considered as an outlier.
- 3 Standard Deviations from Mean – Any value which falls outside of 3 standard deviations from the mean is considered as an outlier.
Outlier Correction Methods in rubiscape
The outlier correction methods in rubiscape are listed below.
- Replace by mean – It replaces the outlier values with mean of the in-range values.
- Replace by median - It replaces the outlier values with median of the in-range values.
- Replace by mode - It replaces the outlier values with mode of the in-range values.
Properties of Outlier Detection
The available properties of Outlier Detection are as shown in the figure given below.
The table given below describes different fields present on Properties of Outlier Detection.
Field | Description | Remark |
|---|---|---|
Task Name | It displays the name of the selected task. | You can click the text field to edit or modify the name of the task as required. |
Columns | It displays a list of columns in the dataset. | You can select the column names to detect the outliers in those columns. |
Group By | It allows you to select the field you want to group by based on the results. |
|
Advanced | It displays advance options for outlier detection. | — |
Method for Outlier Detection | It allows you to choose the outlier detection method. | Available options are:
|
Remove Outliers from Output Data | It allows you to choose the option to remove outliers from the dataset. | Available options are:
|
Outliers to be Treated | It allows you to choose the option to treat the outliers with a method of your choice. | Available options are:
|
Method for Outlier Correction | It allows you to choose the method to correct the outliers in your dataset. | Available options are:
|
Interpretation from Outlier Detection
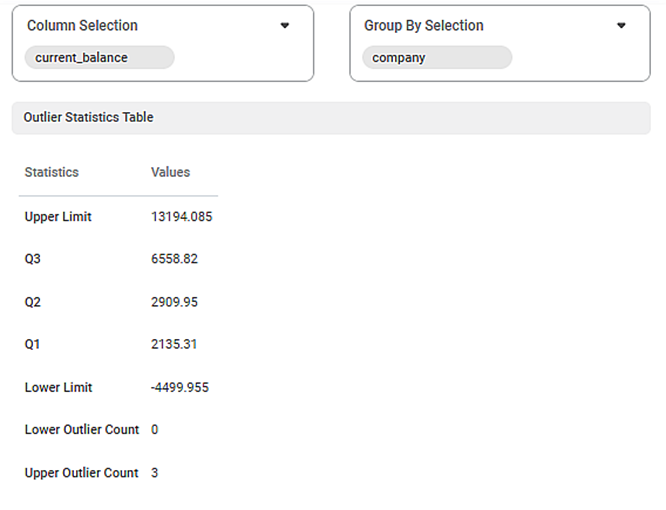
The figure given below displays the output of outlier detection used on a sample data.
The table given below describes the result for outlier detection.
Field | Description |
|---|---|
Column Selection | It allows you to select columns to check outliers in them. |
Group By Selection | It displays the fields on which the results are grouped. |
Outlier Statistics Table | |
Upper Limit | It displays the highest permissible value of the dataset. All values greater than this value are considered as outliers. |
Q3 | It displays the value of third quartile. |
Q2 | It displays the value of second quartile. |
Q1 | It displays the value of first quartile. |
Lower Limit | It displays the lowest permissible value of the dataset. All values less than this value are considered as outliers. |
Lower Outlier Count | It displays the number of outlier values on the lower side of the dataset. |
Upper Outlier Count | It displays the number of outlier values on the upper side of the dataset. |
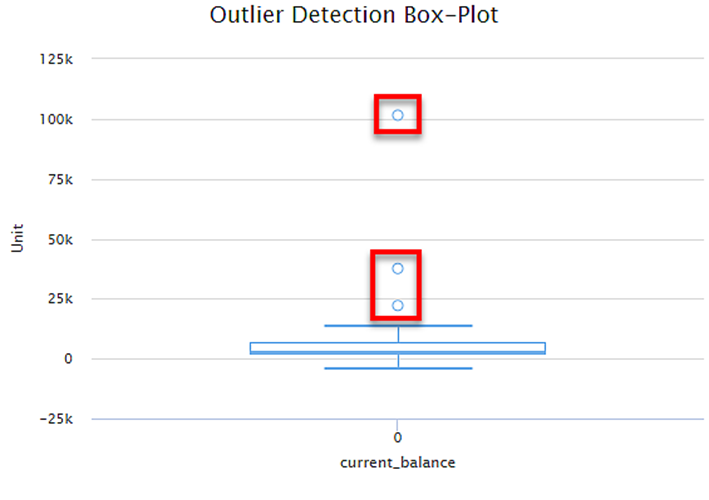
The figure below also describes the box plot for outlier detection. The circles outside the box plot represents the outliers.
Table of Contents


