| LSTM (Long Short-Term Memory) | |||
|---|---|---|---|
| Description | Forecasting and Prediction of the model include numerical and date dataset. | ||
| Why to use | Forecasting Time series | ||
| When to use | To classify, process, and make predictions based on time series data. | When not to use | On textual data and categorical data. |
| Prerequisites |
| ||
| Input | Any dataset that contains time interval as well as numerical type of data. | Output | The predicted value of the dependent variable. |
| Statistical Methods used |
| Limitations |
|
LSTM is a model that can be used for solving Univariate and Multivariate time series forecasting problems. LSTM is used to learn from the series of past observations to predict the next value in the sequence. It has the ability to learn the context required to make predictions, rather than having this context pre-specified and fixed.
With LSTM, the user can select multidimensional functionality for the target variable specifically. The multidimensional functionality allows the user to predict the accuracy or predict the model’s accuracy for multiple dimensions. LSTM is a technique that employs data models and uses statistical tools to predict outcomes. Although LSTM cannot perform future analysis with 100% accuracy, it can predict the possible outcome.
LSTM is located under Forecasting in Modeling, in the task pane on the left. Use drag-and-drop method to use algorithm in the canvas. Click the algorithm to view and select different properties for analysis.
Refer to Properties of LSTM.
Properties of LSTM
The available properties of LSTM are as shown in the figure given below.
The table given below describes the different fields present on the properties of LSTM.
| Field | Description | Remark | |
|---|---|---|---|
| Task Name | It displays the name of the selected task. | You can click the text field to edit or modify the name of the task as required. | |
| Time Id Variable | It allows you to select the variable from the drop-down list for which we need to predict the values of the dependent variable. |
| |
| Target Variables | It allows you to select the experimental or predictor variable(s). |
| |
| Group by | It allows you group the values by a column |
| |
Advanced | Time Steps | It provides feedback from the predicted value going back and forth. | It should be selected as per the data. If the target variables are more than one, time steps can be selected more. |
Dimensions Of Sequence Of Networks | Number of neurons to be used in the model to learn complex pattern from the data. | — | |
| Loss Function |
| There are two types of loss functions:
| |
| Optimizer |
| Adam optimizer is an optimization algorithm that can be used instead of the Classification stochastic gradient descent procedure to update network weights iterative based on training data. | |
| Activation Function |
| The two values are –
| |
| Batch Size |
|
| |
Interpretation of LSTM
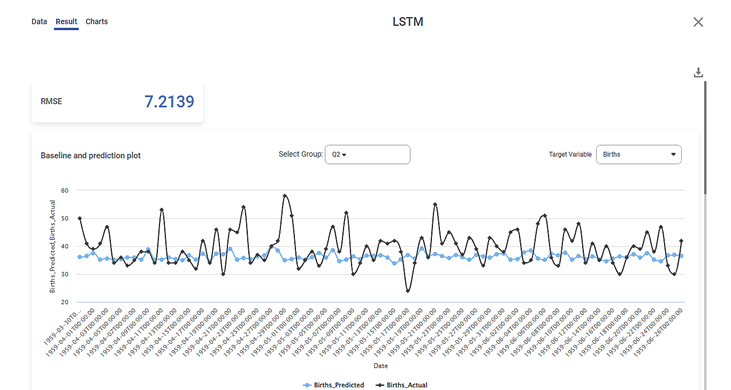
The RMSE value shows the mean of the actual value and the predicted value. The RMSE value should be as small as possible. If the RMSE value is zero, it means it is the best fit model. The best fit model shows there is no difference between the actual value and the predicted value. If the RMSE value is more than zero, you can tweak some parameters to improve the RMSE value.
The chart shows the actual and predicted values for a given time series dataset with a RMSE value. The main aim of plotting this chart is to solve the forecasting problem in univariate and multivariate time series.
In the above example, the RMSE value for Target Variable Birth is 7.2139. We can change some parameters to bring the RMSE value close to zero.
Table of Contents


